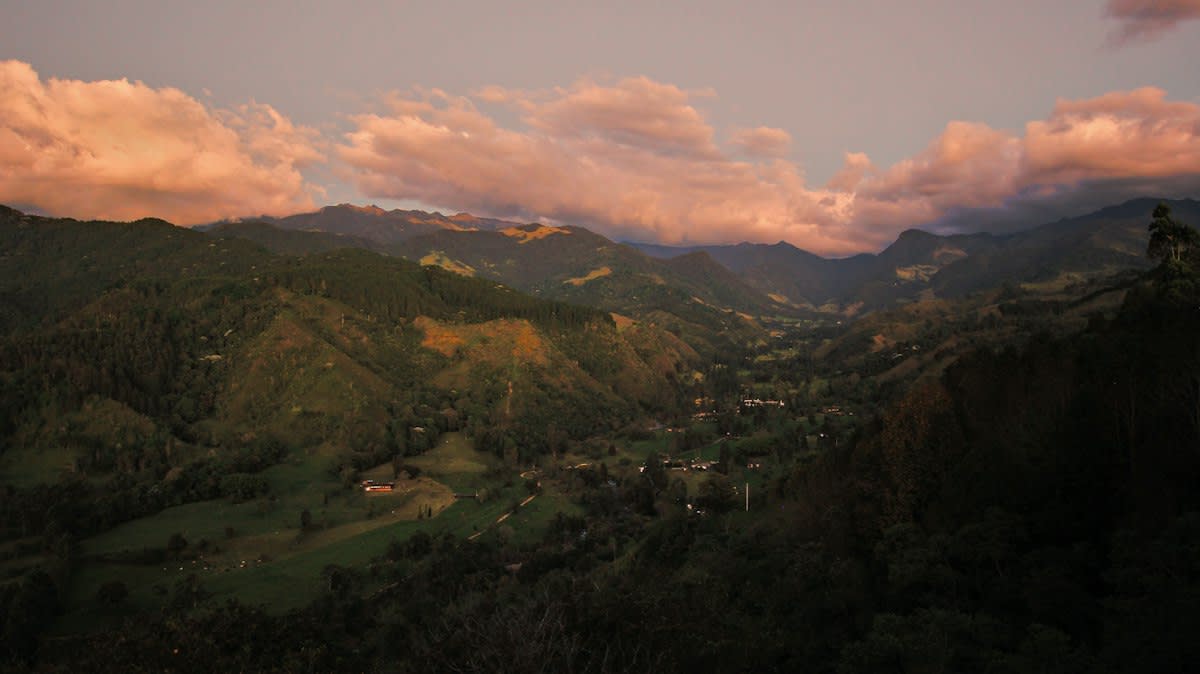
Mapping is not a visual act. We have been conditioned to believe that to chart a territory is to draw its borders, name its peaks, and photograph its flora. This is a mistake. In the Andean foothills of the Peruvian Amazon, the most critical data isn't seen; it is heard. The current move toward sonic mapping represents a hard turn away from the visual hegemony of conservation. By deploying ultrasonic detectors, researchers are capturing a hidden layer of the environment that remains invisible to the human eye and traditional cameras.
The technical core of this shift centers on the use of specialized hardware like the Song Meter Mini Bat (Source: Communications Earth & Environment, 2026). These devices, positioned roughly 1.5 meters above the forest floor, do not simply record sound; they capture the high-frequency echoes that bats use to navigate and hunt. This isn't just about counting species. It is about understanding the overlap between local management and landscape-scale biodiversity. When these acoustic tools are integrated into tropical agroforests, they reveal how biodiversity, multifunctionality, and crop yields—specifically for cacao (Theobroma cacao L.)—interact in ways a visual survey would miss (Source: Communications Earth & Environment, 2026).
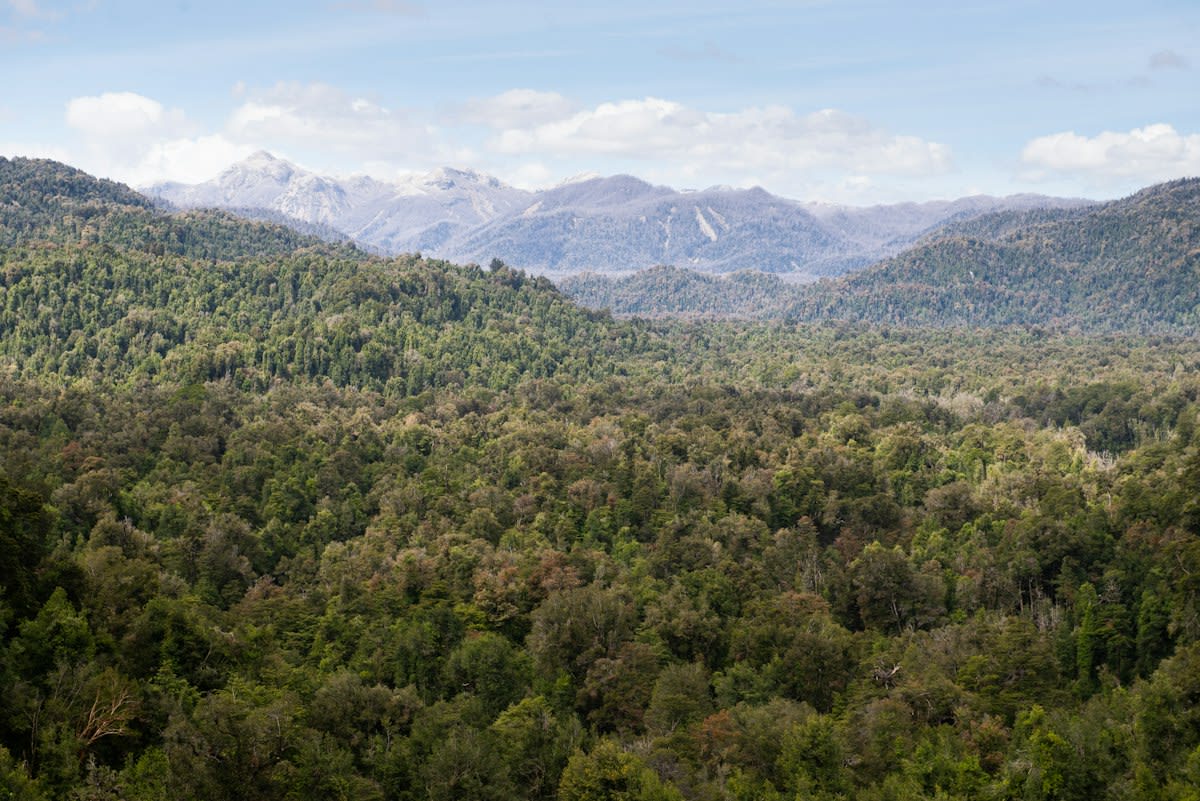
The Friction of Frequency Overlap
But the data is noisy. For the practitioner on the ground, the primary struggle is not the deployment of hardware, but the interpretation of the signal. There is a persistent, internal dispute in the field of bioacoustics regarding the reliability of acoustic detectors for certain species. For example, while these tools are the standard for surveying aerial insectivorous bats in the Neotropics, they are notoriously unreliable for phyllostomid species (Source: Communications Earth & Environment, 2026). Why? Because of frequency overlap. When two different species emit calls that occupy the same sonic space, the machine sees a single data point. The human analyst sees a contradiction.
"Acoustic detectors... cannot reliably assess phyllostomid species richness due to high structural and frequency overlap in their echolocation calls."— Arias-Aguilar, A. et al., as cited in Communications Earth & Environment (2026)
This technical limitation creates a blind spot in the map. Practitioners often argue over whether to trust the automated counts or to insist on the slower, more invasive method of physical capture. This is where the real work happens: in the gap between what the sensor records and what the biologist knows to be true. The reliance on ultrasonic detectors is a gamble on the precision of the software to disentangle these overlapping calls, a task that remains a point of contention in Neotropical biodiversity studies (Source: Arias-Aguilar, A. et al., 2018).
The AI Layer: From Bats to Guqin
The trend is expanding beyond ecology into a broader effort to decode non-human and historical sound. This is no longer just about bats in the Andes. We are seeing a web of similar initiatives using AI to interpret complex sonic patterns across the globe. For instance, the Humanities and AI Virtual Institute is developing tools to recognize cultural differences in sound, such as the historical Chinese musical notation of the guqin, a seven-string instrument (Source: Schmidt Sciences, 2026). The goal is the same as the Andean project: to make a massive, inaccessible collection of data—over 30,000 compositions in the case of the guqin—accessible for scholarly study.
Is there a link between a bat's call in Peru and a 10th-century Chinese melody? Yes. Both are problems of pattern recognition in noisy environments. The same AI logic used to distinguish between species of whales, orcas, and parrots—investigating whether dialect and sound change occur in other species—is being applied to the sonic mapping of the natural world (Source: Schmidt Sciences, 2026). We are moving toward a world where AI does not just transcribe sound, but interprets the cultural and biological context of the noise.

Comparing the Delta: Then vs. Now
Twelve months ago, acoustic monitoring was largely a tool for census-taking—counting how many individuals of a species existed in a given area. Today, it has evolved into a tool for functional mapping. In the Andean foothills, the focus has shifted from simple species richness to understanding how acoustic data reflects the health of the cacao agroforests (Source: Communications Earth & Environment, 2026). We are now seeing the integration of local management with high-tech monitoring to ensure that the production of fine-flavor native cacao varieties provides a viable genetic alternative to deforestation.
| Metric | Traditional Visual Survey | Current Sonic Mapping |
|---|---|---|
| Data Collection | Physical capture/Sighting | Passive Ultrasonic Recording |
| Temporal Scope | Snapshot/Intermittent | Continuous/24-7 |
| Primary Friction | Logistical access/Animal stress | Frequency overlap/Signal noise |
| Analytic Tool | Manual Identification | AI-driven Pattern Recognition |
This evolution is not without its pitfalls. The push for automation often overlooks the nuance of the terrain. When AI is used to analyze historical manuscripts or artistic works, there is a risk that it will overlook cultural differences rather than recognize them (Source: Schmidt Sciences, 2026). Similarly, in the Andes, an over-reliance on automated bat detectors could lead to a skewed understanding of species richness if the frequency overlap of phyllostomid bats is not manually corrected by a human expert.
Fact-Check & Accuracy Note
The methodology relies on Song Meter Mini Bat detectors positioned 1.5m above ground. A key academic debate persists regarding the efficacy of these tools for phyllostomid bats due to acoustic overlap. Sources include Communications Earth & Environment (2026) and Arias-Aguilar et al. (2018).
Editorial Note
Editorial Note: This report emphasizes the shift from visual to acoustic data. While the term 'mapping' is used, this refers to biological and cultural data charting, not traditional cartography.
The result is a new playbook for conservation. Instead of fighting the noise of the jungle, researchers are using it. By accepting the contradiction of the signal—the overlap, the static, the hidden frequencies—they are building a more honest map of the Andes. It is a map that acknowledges what we cannot see and listens to what we have spent centuries ignoring.