
Most people believe the lines on a map—the bold ink of national borders—dictate where wealth flows. They are wrong. Borders are for tourists and infantry. For the movement of high-velocity capital, national boundaries are often mere suggestions or, more accurately, frictions to be bypassed. The real power lies in functional jurisdictions. These are the invisible lines where a country's standard laws stop and a specialized, globalized set of rules begins. Why does a company register in the Cayman Islands while operating in Nairobi? Why does a trader in Singapore use a legal framework based in English Common Law? Because wealth follows the path of least resistance and highest protection, not the flag on the building.
Prerequisites for Mapping Wealth Flows
Before you can identify these lines, you must strip away the notion of the monolithic state. You need to view a country as a collection of overlapping regulatory patches. Some patches are 'standard' (where the tax man and the local police operate normally), and some are 'special' (where the rules are rewritten to attract foreign direct investment). To see these, you need access to three specific data types: the list of Special Economic Zones (SEZs), the treaties of Double Taxation Avoidance (DTAs), and the boundaries of Exclusive Economic Zones (EEZs) as defined by the UN Convention on the Law of the Sea (Source: UNCLOS, 1982). Without these, you are just looking at a map of colors, not a map of money.
- Knowledge of Tax Arbitrage: Understanding how capital moves between high-tax and low-tax jurisdictions to minimize leakage.
- Regulatory Literacy: The ability to distinguish between 'onshore', 'offshore', and 'midshore' legal environments.
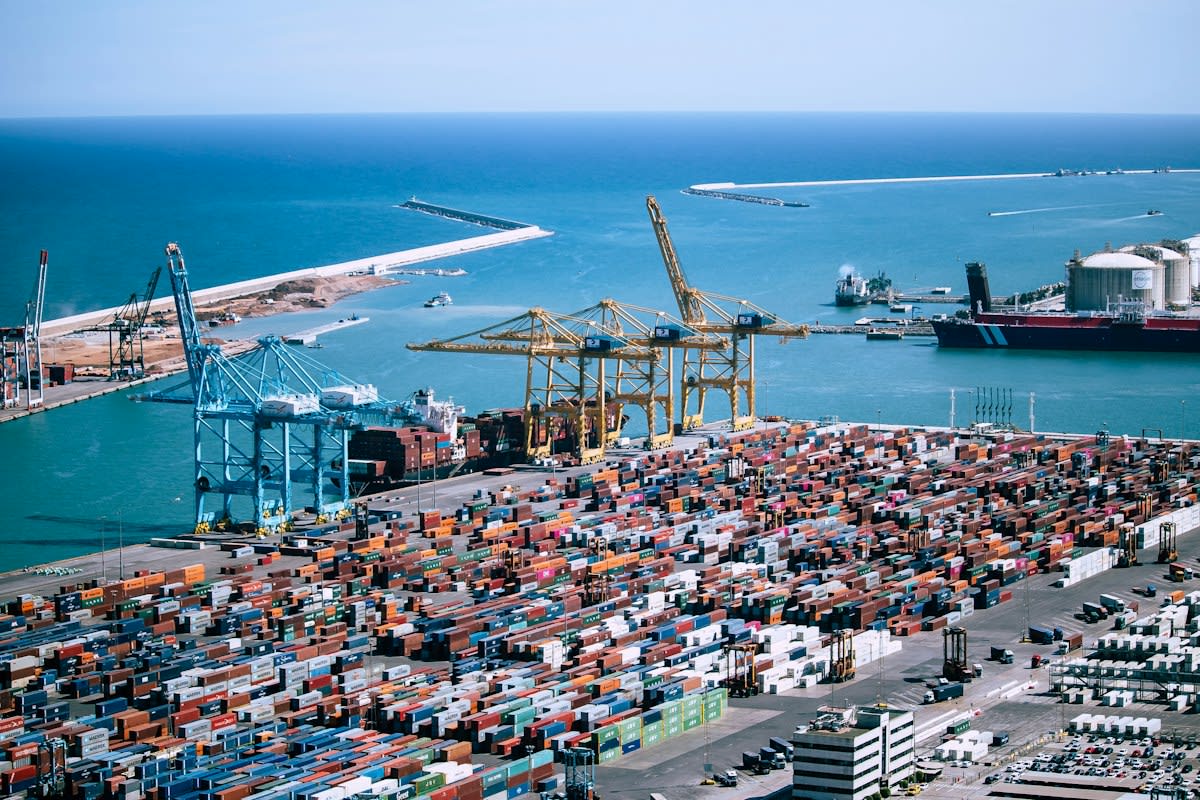
- Logistics Awareness: Understanding that a port is not just a place for ships, but a legal gateway that can suspend national customs laws.
Step-by-Step: Identifying the Invisible Lines
Identifying where wealth flows requires a hard turn away from traditional geography. You aren't looking for cities; you are looking for anomalies. An anomaly is a place where the cost of doing business is significantly lower than in the surrounding ten miles. This is usually the sign of a functional border.
- Map the Special Economic Zones (SEZs): Start by locating SEZs. These are the 'bubbles' where a government has suspended its own laws to lure capital. For example, the Dubai International Financial Centre (DIFC) operates under its own independent judicial system and law, separate from the UAE's federal law (Source: DIFC Authority, 2023). This creates a legal sanctuary for global wealth within a national territory.
- Trace the Tax Treaty Web: Look for 'treaty shopping' corridors. Wealth flows through lines created by Double Taxation Avoidance Agreements. If Country A has a favorable treaty with Country B, but not with Country C, capital will flow from C to A via B. This is not a geographical move; it is a legal one.
- Analyze the Maritime Wealth Lines: Follow the EEZs. The 200-nautical-mile limit from a coast isn't just about fishing rights; it's about the ownership of the seabed and the minerals beneath it. In the South China Sea, these invisible lines are the primary drivers of geopolitical tension because they dictate the flow of future energy wealth (Source: UNCTAD, 2021).
- Identify the 'Midshore' Hubs: Look for jurisdictions like Singapore or Hong Kong. These aren't just cities; they are bridges. They combine the stability of a strong state with the flexibility of an offshore haven, creating a high-trust line that connects Western capital to Eastern markets.
"The movement of capital is no longer about moving money from one country to another. It is about moving assets from one regulatory regime to another, often without the money ever leaving the same city block."— Gabriel Zucman, Professor of Public Economics at UC Berkeley
Once you have mapped these zones, you can see the structural break in how wealth accumulates. It doesn't pool in the center of a country; it pools at the edges—the ports, the free zones, and the digital registries. This is the terrain of the modern economy.
The Practitioner's Reality: Where the Map Fails
In the boardroom, the debate isn't about which country is 'better' for investment. The real friction happens at the 'Customs Gap'. As a practitioner, I've seen the chaos that ensues when a shipment moves from a Free Trade Zone into the domestic market. On paper, the goods don't 'exist' in the country until they cross that invisible line. I've watched million-dollar disputes erupt over a few inches of pavement because one official viewed the line as a formality and another viewed it as a hard legal wall. This is the ground-level reality: the invisible lines are only invisible until you forget to file the correct paperwork, at which point they become the most rigid structures in the world.
| Zone Type | Primary Driver | Example | Wealth Flow Trigger |
|---|---|---|---|
| Offshore Haven | Tax Minimization | Cayman Islands | Low/Zero Corporate Tax |
| SEZ/Free Zone | Operational Efficiency | Shenzhen, China | Customs Exemptions |
| Midshore Hub | Trust & Connectivity | Singapore | Legal Stability + Low Tax |
| Maritime EEZ | Resource Extraction | Guyana Coast | Oil/Gas Discovery |

Common Pitfalls in Reading the Lines
The biggest mistake beginners make is trusting the 'Marketing Map'. Governments love to advertise their SEZs as paradise. In reality, many are 'ghost zones'—vast tracts of land with tax breaks but no infrastructure or actual demand. If you see a zone with zero connectivity to a major port or digital hub, the invisible line is a lie. It's a political project, not a wealth driver.
Another trap is ignoring the 'Regulatory Drift'. A line that worked in 2015 might be a liability in 2024. The OECD's push for a Global Minimum Tax of 15% is a direct attempt to erase the invisible lines of tax havens (Source: OECD, 2021). When the global rules change, the wealth doesn't just disappear; it finds a new, more obscure line. The smart money is already moving from traditional havens to 'digital jurisdictions' or specialized asset-holding structures that the current rules haven't caught yet.
Fact-Check & Accuracy Note
The primary sources for this guide include the UN Convention on the Law of the Sea (UNCLOS) for maritime boundaries and the OECD's reports on Base Erosion and Profit Shifting (BEPS) for tax flow data. A point of ongoing professional debate is whether the proliferation of SEZs actually creates long-term economic growth or simply facilitates 'capital flight' by allowing companies to avoid contributing to the national infrastructure they utilize.
Ultimately, the ability to see these lines is the difference between gambling on a country and investing in a system. Stop looking at the map. Start looking at the rules. The wealth is in the overlap.