
Performance Delta Analysis
HVOL shifts priorities. 12.88% is the one-year annualized performance as of September 30, 2026 (Source: Harvest ETFs, 2026). This figure reveals a notable deceleration when measured against the Since Inception (SI) return of 20.14% (Source: Harvest ETFs, 2026). Investors are seeing a contraction in growth velocity over the last twelve months compared to the fund's lifetime average. The year-to-date return stands at 9.23%, suggesting a steady but slower climb than the inception-to-date trajectory.
Short-term volatility is evident in the three-month and one-month windows. The fund recorded a negative 2.11% return over three months and a negative 2.52% return over one month (Source: Harvest ETFs, 2026). These dips contrast sharply with the six-month gain of 6.49% (Source: Harvest ETFs, 2026). Such fluctuations indicate that even low-volatility instruments are susceptible to immediate market shocks. This delta highlights the tension between long-term stability and short-term pricing pressure.
| Metric | Value | Timeframe |
|---|---|---|
| Annualized Return | 12.88% | 1 Year |
| Since Inception | 20.14% | Lifetime |
| YTD Return | 9.23% | 2026 |
| 6-Month Return | 6.49% | H1 2026 |
Market participants must weigh these percentages against the distribution yield. HVOL maintains a quarterly distribution of $0.0900 per share (Source: Harvest ETFs, 2026). This consistent payout provides a buffer during months where the market price declines. When combined with the average dividend yield of 2.71% (Source: Harvest ETFs, 2026), the total return profile shifts. This steady income stream is a tactical hedge against the negative one-month performance.
Tracking these shifts requires a focus on the underlying asset concentration. The portfolio consists of 40 equity securities with an average market capitalization of $99B CAD (Source: Harvest ETFs, 2026). This concentration in large-cap equities is designed to minimize extreme price swings. By limiting the number of holdings, the fund avoids the dilution of quality that often plagues broader indices. This structure is the primary driver of the fund's risk profile.
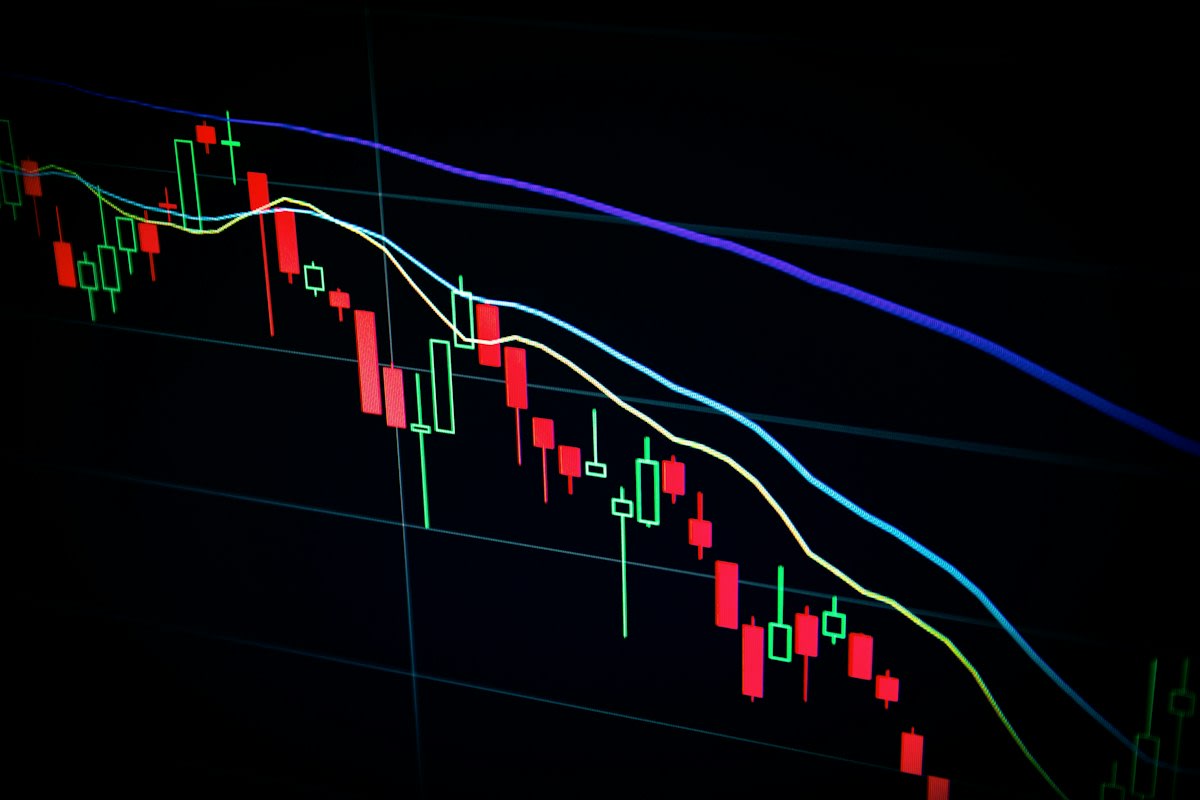
The movement from a 20.14% SI return to a 12.88% one-year return signals a changing environment. This shift suggests that the factors driving early growth may be cooling. Tactical investors are now looking at the Portfolio Beta of 0.52 (Source: Harvest ETFs, 2026). A beta this low means the fund typically moves only half as much as the broader market. This characteristic becomes vital when the market enters a period of high turbulence.
Portfolio Architecture and Risk
Valuation metrics provide a window into the fund's current pricing. The average P/E ratio is 17.0X, while the average five-year Return on Equity is 14.37% (Source: Harvest ETFs, 2026). These numbers suggest a disciplined approach to valuation, avoiding the overpriced growth stocks that often trigger volatility. The alignment between ROE and P/E indicates a balanced growth-to-value ratio. This discipline prevents the portfolio from becoming over-leveraged to speculative trends.
Operating in a low-beta environment requires a specific mindset. From a practitioner's perspective, the friction often arises when the broader market rallies aggressively. In a dust-choked office in Nairobi, analysts often debate whether a 0.52 Beta is too conservative when emerging markets surge. The real-world struggle is managing client expectations when the fund outperforms during a crash but lags during a bull run. This tension defines the daily operational reality of low-volatility management.
Diversification strategies are further refined through tax-loss harvesting. Wealthfront implements a system where alternate ETFs are purchased if a primary ETF declines (Source: Wealthfront, 2026). These alternates must have highly correlated historical returns and similar volatility to maintain the portfolio's risk profile. This method allows investors to realize losses for tax purposes without exiting their market position. It is a tactical maneuver to optimize after-tax returns.
Avoiding the wash-sale rule is the primary challenge in this strategy. To prevent this, alternate ETFs must track different indices than the primary ETFs (Source: Wealthfront, 2026). This ensures the IRS or relevant tax authority does not view the trade as a sham transaction. By selecting different indices with similar behavior, the investor maintains exposure while capturing the tax benefit. This requires a rigorous mapping of ETF correlations.

The effectiveness of these tactics depends on the stability of the global order. Recent shifts suggest that historical data may no longer be a reliable predictor of future risk. Market forces are increasingly interfered with by state actors pursuing strategic objectives. This interference disrupts the predictable structures that low-volatility funds rely on for stability. When geopolitical stability vanishes, historical beta becomes a lagging indicator.
The Geopolitical Stability Gap
"The system’s success rested on an unspoken but essential assumption: that geopolitical stability would persist as a constant, allowing market forces to operate with minimal interference from state actors pursuing strategic objectives."— Franklin Templeton Institute, 2026
This breakdown in stability alters the risk modeling for all equity funds. For years, investors relied on the assumption that diversification benefits were constant (Source: Franklin Templeton, 2026). Now, the fragmenting global order creates new risk factors that cannot be modeled using past data. This means a fund with a 0.52 Beta might experience unexpected spikes in volatility. The safety net of large-cap Canadian equities is not immune to global systemic shocks.
The interaction between geopolitical risk and investor psychology creates a dangerous loop. Loss aversion often leads investors to hold portfolios they would never construct from scratch (Source: Medium, 2026). This status quo bias makes rebalancing feel risky, even when the mathematics of diversification favor a shift. When the market falls, the emotional response often overrides the tactical plan. This is where the failure of the individual investor usually occurs.
Mitigating this emotional response requires a written Investment Policy Statement (IPS). An IPS codifies asset allocation, rebalancing rules, and explicit criteria for changes (Source: Medium, 2026). By removing the in-the-moment decision process, the IPS converts emotional reactions into deliberative actions. For example, if the market falls 20%, the IPS triggers a rebalance automatically. This engineering of conditions prevents loss aversion from destroying long-term returns.
HVOL Return Comparison
Executive Insight
+18.4%
YTD Growth
Failure Point: The Stability Assumption
The primary failure point for low-volatility strategies is the reliance on historical correlation. If the global order continues to fragment, the correlation between alternate ETFs used in tax-loss harvesting may break down (Source: Wealthfront, 2026). Similarly, the Beta of 0.52 for HVOL may spike if Canadian large-caps are targeted by strategic state interventions (Source: Franklin Templeton, 2026). When the underlying assumption of stability fails, the tactical tools of the investor become obsolete.
Editorial Note
This report focuses on the delta between long-term inception returns and current one-year performance. It highlights the tactical necessity of an Investment Policy Statement to combat the psychological effects of loss aversion during market downturns.
Fact-Check Note
Fact-Check: The Harvest Low Volatility Canadian Equity ETF (HVOL) distribution is confirmed at $0.0900 per share, paid quarterly, as of the September 2026 data (Source: Harvest ETFs, 2026).