
Forty-three dollars per megawatt hour. This global weighted-average LCOE for newly commissioned utility-scale solar PV, reported by IRENA in 2024, represents a 90 percent collapse from the 2010 benchmark of 417 dollars per megawatt hour (Source: GreentechLead, 2026). The raw physics of the silicon-etched wafer have been squeezed to their limit. We are no longer watching a plummet; we are scrubbing the floor for the last few cents of efficiency. For the operator in the field, this means the game has moved from the lab to the balance sheet.
Hardware Prerequisites for the Floor
Steel and silicon. To hit these numbers, you need a supply chain that functions like a conveyor belt, moving from polysilicon to wafers, cells, and finally modules without a single oxidized link (Source: GreentechLead, 2026). This is why China dominates; they have integrated the entire copper-wire ecosystem into a single industrial machine. If your procurement is fragmented, your LCOE will balloon regardless of how cheap the panels are on paper. You need secured access to critical minerals and a logistics route that avoids the friction of fragmented trade policies.
- Tier-1 silicon-etched modules priced near $0.08 per watt (Source: McKinsey, 2026).
- High-conductivity copper-wire cabling to minimize transmission bleed.
- Industrial-grade mounting racks with anti-oxidized coatings for high-salinity or desert districts.
- Fiber-optic monitoring arrays for real-time degradation tracking.
- Secured land rights in high-irradiance zones with existing grid-interconnects.
Execution: Deploying the Low-Cost Asset
Speed is the only metric. In the dust-choked construction sites of India, operators have driven average installed costs down to approximately $525/kW (Source: GreentechLead, 2026). This is achieved through aggressive labor scaling and localized assembly. You cannot import a turnkey solution and expect floor-level LCOE. The grit of the installation—the actual bolting of the frames into the earth—is where the remaining margin is won or lost.
- Secure a Power Purchase Agreement (PPA) that reflects current market floors, potentially as low as $13/MWh in markets like Saudi Arabia (Source: GreentechLead, 2026).
- Source modules directly from integrated ecosystems to lock in the $0.08/watt benchmark (Source: McKinsey, 2026).
- Optimize site layout using LED-bleached simulation software to minimize shading and maximize photon capture.
- Install utility-scale battery storage to relocate production from sunny peaks to high-demand evening windows.
- Audit the balance of system (BOS) costs to ensure copper-wire and inverter losses do not erode the $43/MWh global average.
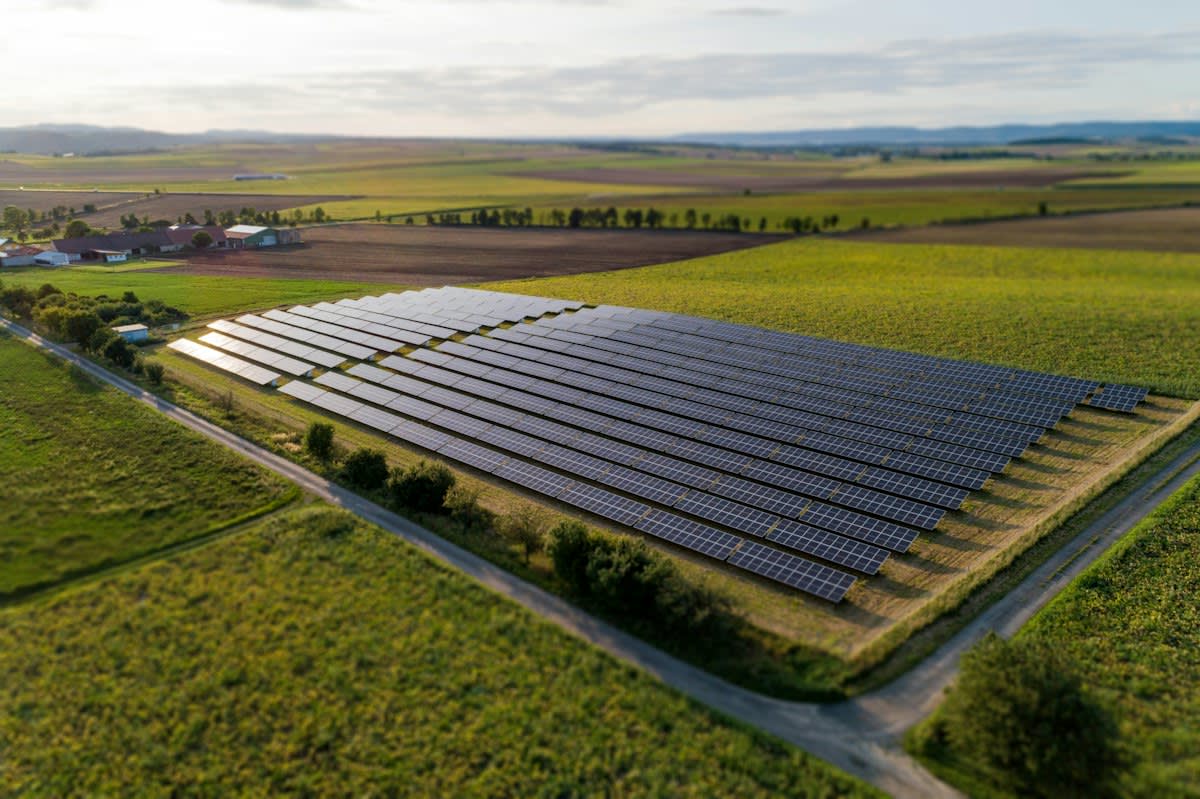
The LCOE vs. PPA Divergence
Numbers lie. A PPA is a contract; LCOE is a lifetime estimate of capital expenditure, operating expenses, and financing (Source: GreentechLead, 2026). You can see PPAs in Saudi Arabia hitting $13/MWh, but that does not mean the electricity costs that little to produce in a vacuum (Source: GreentechLead, 2026). The PPA is the price the buyer agrees to pay; the LCOE is the internal reality of the project's oxygen. If your LCOE is $33/MWh and your PPA is $13/MWh, you are operating on a prayer or a massive government subsidy.
| Region/Metric | LCOE ($/MWh) | Installed Cost ($/kW) |
|---|---|---|
| China | 33 | Not Specified |
| India | 38 | 525 |
| Global Average | 43 | 691 |
This divergence creates a dangerous gap for the field operator. When you see the global weighted-average LCOE of $43/MWh (Source: IRENA, 2024), remember it is an average. In fragmented trade zones, such as the U.S., cost headwinds from trade policy can push these numbers higher, regardless of how cheap the silicon is in China (Source: McKinsey, 2026). You are fighting a war of tariffs and critical mineral scarcity, not just a war of efficiency.
"The decade-long decline in renewable energy costs paused in 2024. Average generation costs rose 0.6 percent for solar photovoltaic and 2.7 percent for wind over 2023, the first increase since 2014."— Global Innovation Tracker, World Intellectual Property Organization (WIPO), 2026
Integrating the Storage Multiplier
Sunlight is inconsistent. Standalone plants dump power into the grid when everyone else is doing the same, crashing the spot price. This is where battery storage becomes the only way to protect the LCOE. Costs for utility-scale storage have plummeted 93 percent since 2010, dropping from $2,571/kWh to $192/kWh (Source: IRENA, 2024). By adding storage, you move your electricity from the midday trough to the evening peak, effectively changing the value of every megawatt hour produced.
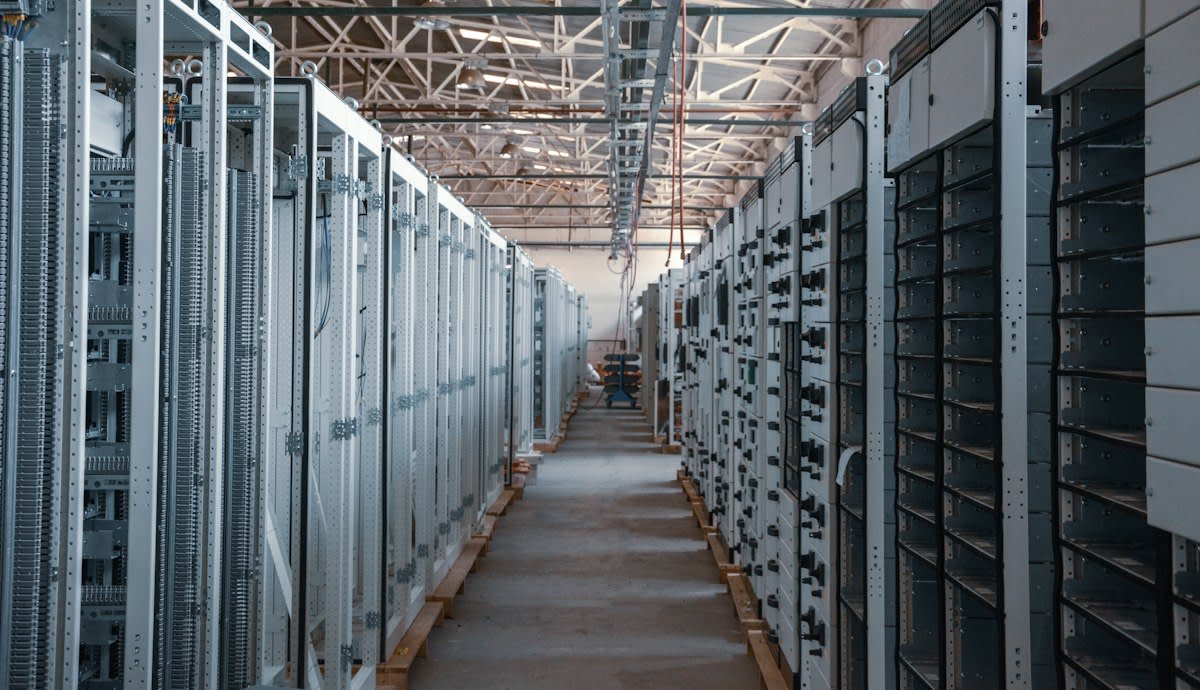
The practitioner's reality is one of constant friction. In the heat of a Rajasthan solar park, the debate isn't about the silicon's purity; it's about whether the financing costs are eating the 0.6 percent efficiency gain. You see engineers fighting over the gauge of the copper-wire to save a fraction of a percent in transmission loss, while the procurement office argues over trade tariffs that add 20 percent to the module cost. It is a brutal balancing act where the theoretical LCOE meets the greasy reality of site logistics.
The Failure Point: The End of the Learning Curve
Learning curves are lying. For a decade, we assumed that more capacity always meant lower costs, but that logic has hit a wall. Solar LCOE rose 0.6 percent in 2023, the first increase in ten years (Source: WIPO, 2026). This failure point is driven by higher financing costs and the volatility of critical minerals. We have reached the point where the cost of the silicon-etched cell is negligible compared to the cost of the money used to buy it.
Geopolitics now dictate the economics. Fragmented trade policy in the U.S. and elsewhere means that equipment costs are no longer guaranteed to fall (Source: McKinsey, 2026). When trade barriers rise, the integrated supply chain that drove China to $33/MWh (Source: IRENA, 2024) is severed. Operators who rely on the 'inevitable' decline of costs will find themselves with stranded assets and bankrupt SPVs.
Fact-Check & Accuracy Note
This report relies on IRENA 2024 datasets, WIPO 2026 Global Innovation Tracker, and McKinsey 2026 Global Energy Perspective. All LCOE figures are weighted averages. Local variances based on land cost and grid congestion are not included in the global average.
Editorial Perspective
Editorial Note: The transition from 'cost-reduction' to 'cost-management' marks a new era in energy deployment. The focus has moved from the hardware (silicon) to the software (financing and policy).
Common Pitfalls in Floor-Level Deployment
Ignoring the BOS. Many operators focus exclusively on the module price of $0.08 per watt (Source: McKinsey, 2026) and forget the copper-wire, the inverters, and the labor. In India, the installed cost of $525/kW is a result of optimizing these 'invisible' costs (Source: GreentechLead, 2026). If you overspend on the site prep or use inefficient cabling, you will never hit the $43/MWh global average.
Underestimating financing. The 0.6 percent rise in solar costs reported by WIPO in 2026 is a warning shot (Source: WIPO, 2026). Higher interest rates act as a tax on every kilowatt produced. When the cost of capital rises, the LCOE rises, even if the hardware gets cheaper. The floor is not a solid slab; it is a membrane that fluctuates with the central banks.