
Most people treat their health like a black box. They feel fine, they eat reasonably well, and they wait for an annual physical to tell them if something is broken. This is reactive medicine. It is a strategy based on failure—you only act once a system has already malfunctioned. Why accept a paradigm where the first signal of disease is a symptom? For the sophisticated individual, the goal is not the absence of disease, but the presence of optimal function. This requires a biological baseline: a high-resolution map of your personal markers that allows you to spot a deviation long before it becomes a diagnosis.
The central fallacy of modern medicine is the 'normal range.' These ranges are typically derived from a bell curve of the general population. If the general population is chronically inflamed and metabolically dysfunctional, the 'normal' range is simply a reflection of collective mediocrity. To preempt disease, you must stop asking if you are 'normal' and start asking if you are 'optimal.' This shift in perspective transforms your health data from a static report card into a dynamic navigation system. By mapping your own unique baseline, you identify your personal 'delta'—the rate of change that signals an emerging issue.
Prerequisites: The Toolkit for Mapping
Before you begin mapping, you need the right infrastructure. You cannot build a high-resolution map with low-resolution tools. You need a combination of static data (what you were born with), dynamic data (what is happening now), and real-time data (how you respond to stimuli). This requires a commitment to data hygiene and a willingness to look at numbers that might be uncomfortable.
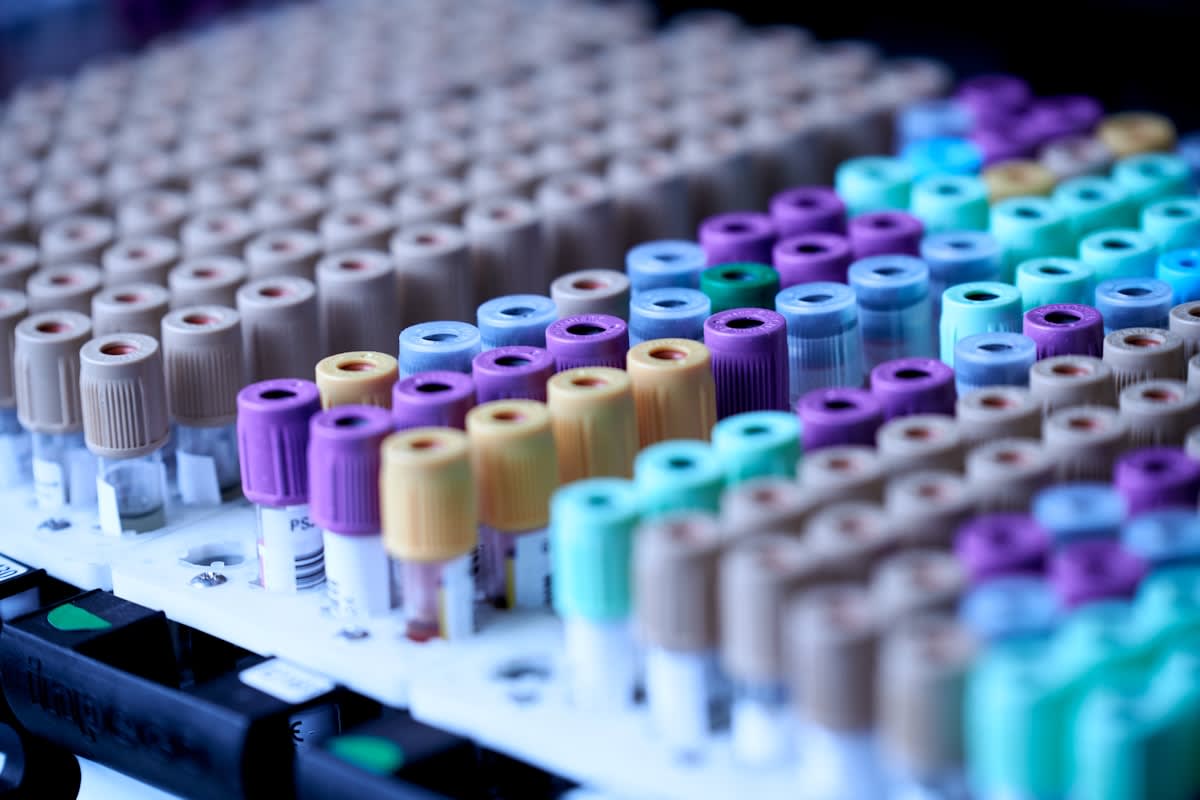
- Comprehensive Blood Panel: Beyond the basic CBC; you need lipid fractions (ApoB), metabolic markers (HbA1c, Fasting Insulin), and inflammatory markers (hs-CRP).
- Genetic Screening: A one-time deep dive into SNPs (Single Nucleotide Polymorphisms) to identify hereditary predispositions.
- Biometric Wearables: A device capable of tracking Heart Rate Variability (HRV), Resting Heart Rate (RHR), and sleep architecture.
- A Secure Data Vault: A digital system (spreadsheet or health app) to track longitudinal data rather than relying on fragmented PDF reports from different clinics.
- A Collaborative Physician: A practitioner who views 'within range' as a starting point, not a finish line.
The Step-by-Step Mapping Process
Mapping your baseline is not a single event; it is a phased deployment. You start with the immutable and move toward the volatile. This allows you to filter out the noise and focus on the signals that actually matter for your specific biology. Whether you are in Tokyo, London, or Sao Paulo, the biological imperatives remain the same, though the environmental stressors vary.
- Establish the Static Blueprint: Begin with a comprehensive genetic test. Identify your risk for cardiovascular disease, metabolic inefficiency, and nutrient absorption issues. This is your 'hard drive'—it tells you what is possible and where your vulnerabilities lie.
- Capture the Dynamic Snapshot: Perform a baseline blood draw in a fasted state. Prioritize ApoB over LDL-C for a more accurate count of atherogenic particles. Measure HbA1c to understand your average blood sugar over 90 days. This is your current 'operating system' state.
- Deploy Continuous Monitoring: Integrate a wearable or a Continuous Glucose Monitor (CGM) for 14 to 30 days. Track how your glucose responds to specific foods and how your HRV recovers after stress. This captures the 'real-time' fluctuations that a single blood draw misses.
- Synthesize the Data: Plot these markers on a timeline. Do not look at a single data point; look for the trend. A marker that is 'normal' but trending upward for three consecutive tests is a signal for intervention.
- Stress-Test the Baseline: Introduce a controlled variable—such as a change in diet or a new exercise modality—and observe which markers shift. This reveals how your unique biology responds to specific interventions.
Is it enough to just have the data? Absolutely not. Data without synthesis is just noise. The magic happens in the intersection. For instance, if your genetics suggest a high risk for inflammation and your hs-CRP is creeping toward the upper limit of 'normal,' you have a clear mandate to adjust your omega-3 intake or sleep hygiene before a chronic inflammatory condition takes root.
Practitioner's Note
The 'Normal' Trap: In many global healthcare systems, a fasting glucose of 99 mg/dL is considered 'normal.' However, for an athlete or someone optimizing for longevity, a reading above 85 mg/dL might indicate early insulin resistance. Always aim for the optimal quartile, not the average.
Critical Markers for Preemptive Mapping
Not all markers are created equal. To avoid 'data fatigue,' focus on the high-leverage indicators that provide the most predictive value for long-term health. These markers act as early warning systems for the three great killers: cardiovascular disease, metabolic syndrome, and neurodegeneration.
| Marker | What it Measures | Standard 'Normal' | Optimal Target |
|---|---|---|---|
| ApoB | Atherogenic particle count | < 90 mg/dL | < 60 mg/dL |
| HbA1c | 3-month glucose average | 4.0% - 5.6% | 4.8% - 5.2% |
| hs-CRP | Systemic inflammation | < 3.0 mg/L | < 1.0 mg/L |
| Fasting Insulin | Insulin sensitivity | 2.6 - 24.9 uIU/mL | 2.0 - 6.0 uIU/mL |
Notice the gap between 'normal' and 'optimal.' That gap is where disease begins. When your fasting insulin is 15 uIU/mL, your blood sugar might still look perfect because your pancreas is working overtime to keep it there. By the time your glucose rises into the 'abnormal' range, you have likely been insulin resistant for a decade. Mapping the baseline allows you to catch the insulin rise while the glucose is still stable.

Common Pitfalls in Health Mapping
The path to optimization is littered with people who became obsessed with the numbers and forgot the human. Data is a tool, not a master. If you are tracking every milligram of a marker but ignoring the fact that you are exhausted and miserable, you are failing the most basic health marker of all: quality of life.
- The Over-Optimization Loop: Spending more time analyzing data than implementing the changes the data suggests. Analysis paralysis is a real risk.
- Ignoring Subjective Data: Your HRV might be perfect, but if you feel burnt out, trust your body over the wearable. Biometrics are proxies, not absolute truths.
- The Snapshot Fallacy: Treating a single blood test as an absolute truth. Markers fluctuate based on sleep, stress, and the last meal you ate. Always look for three-point consistency.
- DIY Diagnosis: Using data to self-diagnose complex conditions without a medical professional. Data identifies the 'what,' but a doctor identifies the 'why'.
Ultimately, the biological baseline is about agency. It is about refusing to be a passive passenger in your own biology. By establishing your markers and tracking their movement, you shift the power dynamic from the clinic to the individual. You are no longer waiting for a crisis to trigger a response; you are managing your health with the precision of an engineer and the intuition of an athlete.