
The Fallacy of Subjective Stress
Most high-performers treat burnout as a sudden cliff they fall off, but in reality, it is a slow erosion of physiological reserves. You do not wake up one Tuesday and suddenly find yourself unable to function; rather, your autonomic nervous system has been screaming in a frequency you have simply trained yourself to ignore. Whether you are a software architect in Tokyo or a surgical lead in Berlin, the biological signals of systemic failure are identical. The problem is that our conscious minds are remarkably adept at rationalizing away exhaustion in the pursuit of a deadline. We call it grit, we call it hustle, but biologically, it is simply a state of sympathetic nervous system overdrive.
Why do we wait until the mental fog is impenetrable to admit we are struggling? The answer lies in the lag between physiological strain and psychological awareness. By the time you feel 'burnt out,' your cortisol levels have likely been dysregulated for weeks, and your heart rate variability has plummeted. The Baseline Method flips this script by moving the detection point from the mind to the body. It transforms the vague feeling of stress into a hard data point, allowing you to intervene while you are still in the 'yellow zone' rather than waiting until you hit the 'red zone' of total collapse.
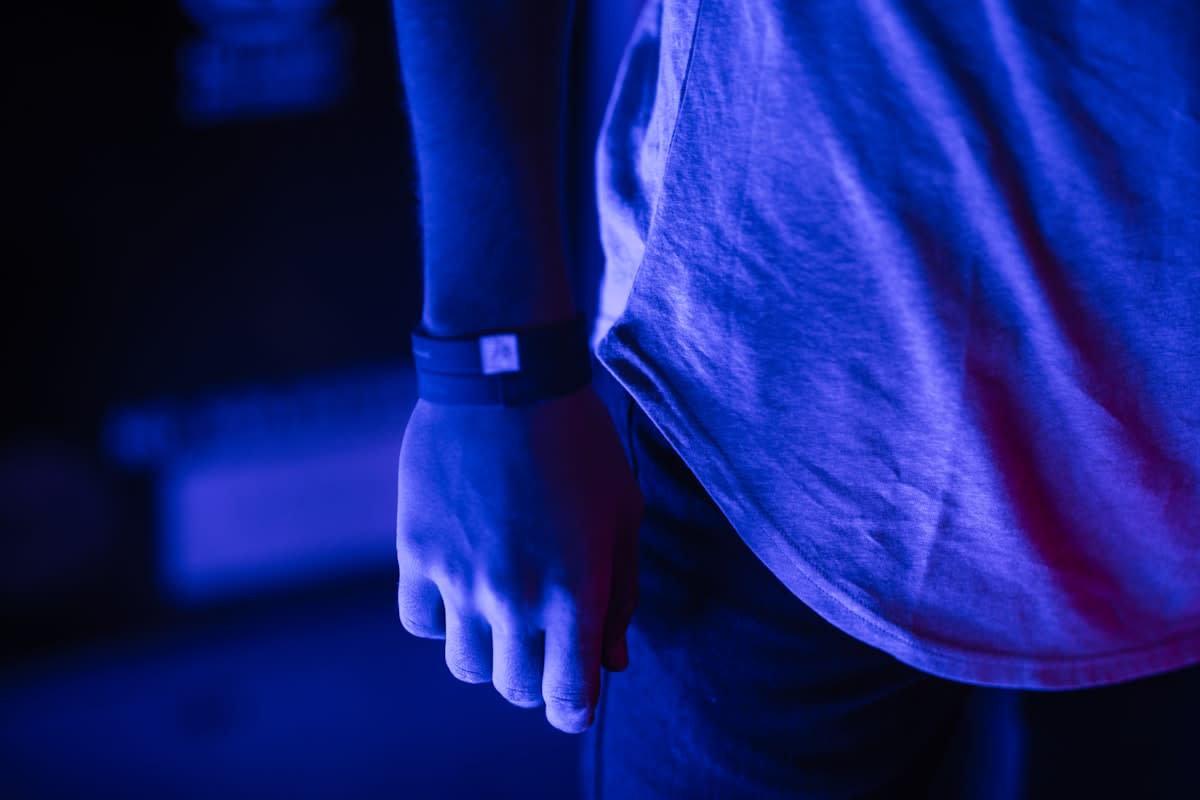
To master this, you must stop comparing your data to global averages. A resting heart rate of 60 bpm might be an athletic baseline for one person and a sign of severe overtraining for another. The only metric that matters is your own historical norm. When you map your personal baseline, you create a mirror that reflects your actual capacity for load, stripped of the ego and professional pressure that usually cloud our judgment.
Prerequisites: Your Biometric Toolkit
You cannot build a baseline with sporadic data. The integrity of the Baseline Method relies on continuous, high-fidelity tracking over a significant window of time. You don't need a medical-grade laboratory, but you do need hardware that captures data during your most critical recovery phase: sleep. Without overnight data, you are merely guessing at your recovery state.
- A high-fidelity wearable (e.g., Oura Ring, Whoop, Garmin, or Apple Watch with sleep tracking enabled) capable of measuring HRV and RHR.
- A data aggregation app that provides rolling averages (7-day and 21-day windows).
- A commitment to wearing the device 24/7 for a minimum of 21 consecutive days.
- A simple digital journal or tagging system to correlate biometric dips with specific life events.
The Core Metric
Heart Rate Variability (HRV) is the gold standard for this method. Unlike your pulse, HRV measures the variation in time between each heartbeat. A higher variability generally indicates a resilient, recovered nervous system, while a low HRV suggests your body is stuck in a stress response.
Once your hardware is in place, the transition from data collection to actionable intelligence begins. It requires a shift in mindset: you are no longer looking for a 'perfect' score, but for a 'stable' pattern. The goal is to define what 'normal' looks like for you when you are functioning at your peak without excessive strain.
Step 1: The Calibration Phase
- Wear your device for 21 consecutive days without exception to account for hormonal cycles, travel, and minor illnesses.
- Ignore the daily fluctuations; focus exclusively on the 7-day rolling average of your Heart Rate Variability (HRV) and Resting Heart Rate (RHR).
- Identify your 'Optimal Window'—the range of values you exhibit during weeks where you feel mentally sharp and physically energized.
- Document your 'Baseline Norms' (e.g., RHR: 58-62 bpm, HRV: 65-80 ms) and save these as your reference points.
Why 21 days? A single week is too volatile. A bad night of sleep or a heavy meal before bed can skew your RHR and tank your HRV, leading to false positives. By extending the calibration to three weeks, you smooth out the noise and establish a statistically significant average. This window allows you to see how your body reacts to a standard work-week cycle, providing a realistic anchor for all future comparisons.
During this phase, resist the urge to optimize. Do not start a new rigorous exercise regime or a restrictive diet. The objective is to capture your current state, not an idealized version of yourself. If you are already moderately stressed, that is your starting point. The Baseline Method is about detecting the delta—the change—from your current state toward a danger zone.
Step 2: Mapping the Variance
With your baseline established, you now move into the monitoring phase. This is where you begin to identify the 'leading indicators' of burnout. You are looking for specific deviations that consistently precede a mental crash. For most people, these signals appear in the data 3 to 7 days before the psychological symptoms of burnout—such as cynicism, irritability, or cognitive fatigue—become obvious.
- Track your daily HRV against your 21-day average. A drop of 20% or more below your baseline for three consecutive days is a primary warning sign.
- Monitor your Resting Heart Rate (RHR). An increase of 5-10 bpm above your norm often indicates systemic inflammation or an inability to recover from stress.
- Analyze sleep efficiency. If your sleep efficiency drops below 85% while your RHR remains elevated, your body is failing to clear metabolic waste from the brain.
- Cross-reference these dips with your calendar. Did the HRV drop coincide with a high-stakes project launch in São Paulo or a period of intense conflict with a stakeholder?
| Metric | Baseline State | Warning State (Yellow) | Burnout Risk (Red) |
|---|---|---|---|
| HRV (Rolling Avg) | Stable/High | 10-20% Decrease | >20% Decrease for 3+ Days |
| Resting HR | Stable/Low | 3-5 bpm Increase | >7 bpm Increase |
| Sleep Efficiency | >90% | 85-90% | <85% |
| Recovery Score | Green/Optimal | Yellow/Sub-optimal | Red/Strained |
The magic happens in the correlation. When you see a 20% drop in HRV alongside a 7 bpm rise in RHR, you have an objective signal that your nervous system is locked in a sympathetic state. You may still feel 'fine'—perhaps you are running on adrenaline—but the data tells you that your biological battery is draining faster than it is recharging. This is the exact moment to deploy your intervention protocol.

Step 3: The Intervention Protocol
Data without action is just noise. Once you hit the 'Yellow Zone' (the warning state), you must have a pre-determined set of levers to pull. The goal is not to stop working entirely, but to reduce the physiological load enough to allow the parasympathetic nervous system to take back control. If you wait until you hit the 'Red Zone,' the recovery time increases from days to months.
- Implement a 'Low-Cognitive Load' day: Cancel non-essential meetings and delegate high-stress tasks for 48 hours.
- Force a parasympathetic shift: Use non-sleep deep rest (NSDR) or box breathing for 20 minutes twice daily to manually lower RHR.
- Aggressive sleep hygiene: Move your bedtime up by 90 minutes and eliminate all blue light two hours before sleep to boost sleep efficiency.
- Reduce CNS stimulants: Cut caffeine intake by 50% until your HRV returns to within 10% of your baseline.
"The most dangerous state for a professional is not stress, but the inability to recover from it. Resilience is not the capacity to endure pain, but the efficiency with which you return to baseline."— Industry Expert on Human Performance
This intervention is a strategic withdrawal, not a defeat. By reducing the load the moment the data signals a dip, you avoid the total systemic crash that characterizes clinical burnout. You are essentially managing your energy like a financial portfolio—taking small, planned losses to avoid a catastrophic market collapse. This approach ensures that when you do return to high-intensity work, you do so with a fully recharged nervous system.
Common Pitfalls in Biometric Mapping
Many users fail the Baseline Method because they fall into the trap of 'data anxiety.' They begin to stress about their stress scores, creating a feedback loop where the act of monitoring actually lowers their HRV. To avoid this, remember that the data is a tool for guidance, not a definitive judgment on your worth or productivity.
- Over-optimizing: Trying to force your HRV higher through supplements or gadgets rather than addressing the root cause of the stress.
- Ignoring Subjective Feel: If your data looks 'green' but you feel like you're drowning, trust your intuition. Data captures physiology, not necessarily psychology.
- The 'One-Day' Panic: Reacting to a single bad night of sleep. Always look at the 3-to-7 day trend, not the 24-hour snapshot.
- Comparing Baselines: Comparing your HRV to a colleague's. This is useless; biometric norms are as unique as fingerprints.
Ultimately, the Baseline Method is about reclaiming agency. In a global economy that demands constant availability, your biology is the only honest metric left. By mapping your norms, you stop being a passive observer of your own exhaustion and start becoming the engineer of your own resilience. The data doesn't just predict burnout—it gives you the permission to recover before it's too late.