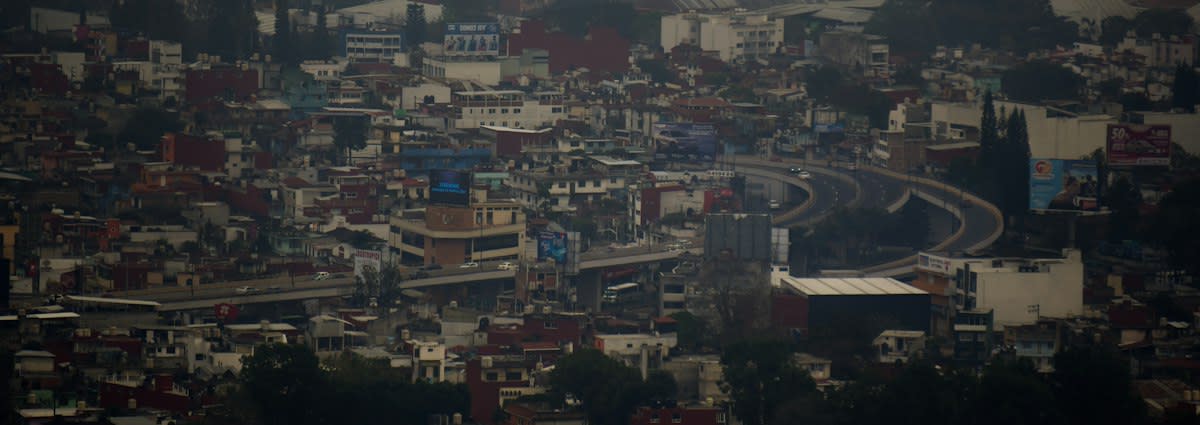
I have spent a decade in the trenches of urban adaptation, and if there is one thing I have learned, it is that top-down climate mandates rarely survive the first contact with a neighborhood. When we talk about cooling a city, we often lean on massive infrastructure projects, but the real wins happen on the rooftops. In places like Mexico City, bold community leaders are reimagining the concrete slabs above their heads not just as shelters, but as thermal buffers. By converting these spaces into soccer pitches with reflective surfaces, they are tackling the urban heat island effect at the source. This is not about playing a game; it is about survival in a world where extreme heat is driving more people into emergency rooms and straining under-resourced hospitals (Source: Climate Central, 2026).
Prerequisites: What You Will Need Before Breaking Ground
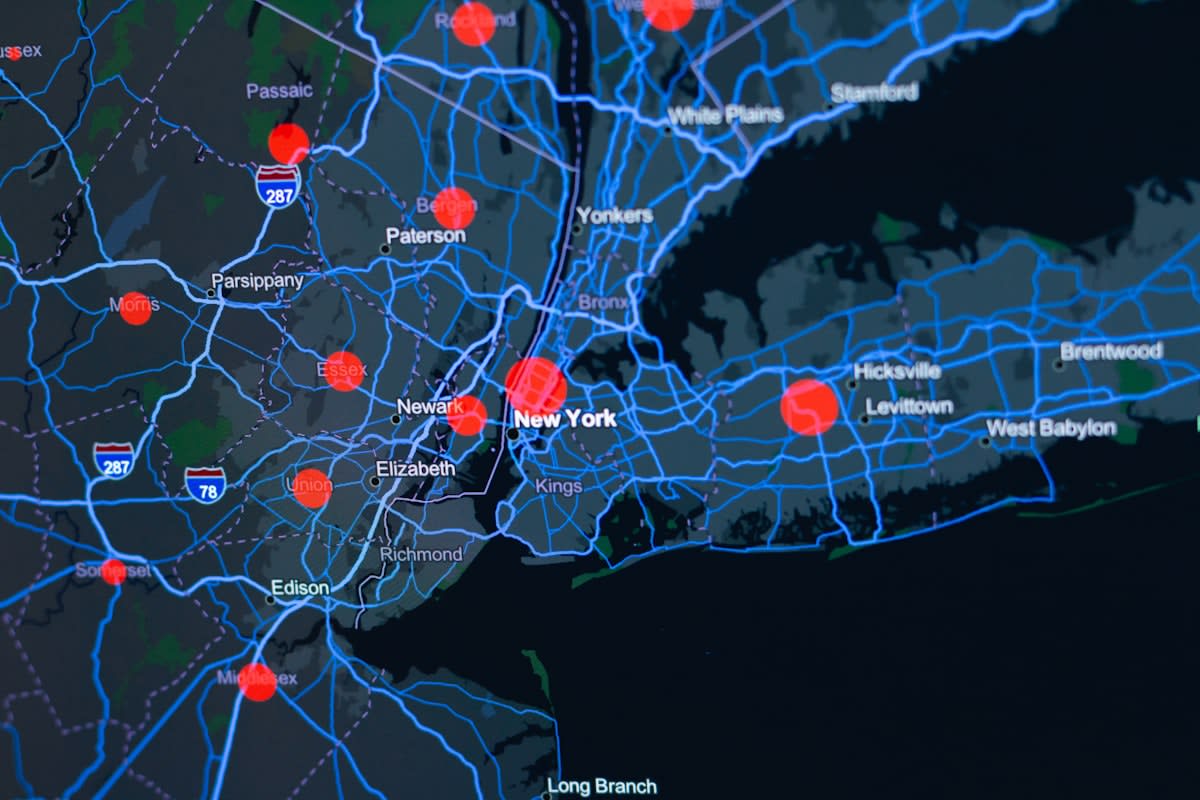
You cannot just slap some turf on a roof and call it a cooling center. To actually lower the ambient temperature of a neighborhood, you need a data-driven foundation. First, you need access to hyper-local heat data. General city-wide averages are useless because heat varies wildly from one block to the next. You need to know exactly when and where your community is most vulnerable during a 24-hour cycle (Source: KJZZ, 2026). Second, you need a physical risk assessment. You must understand the raw physical exposure of your building to climate hazards before you can implement a resilience-adjusted strategy. Finally, secure a funding pipeline that recognizes overheating as a resilience failure rather than a simple maintenance issue (Source: ResponseSource, 2026).
- Neighborhood-specific heat mapping tools to identify peak exposure windows (Source: KJZZ, 2026).
- A Climate Risk & Resilience Index (CRRI) baseline to measure current physical risk (Source: Gizmodo, 2026).
- Reflective, light-colored coating materials similar to cool pavement technologies (Source: KJZZ, 2026).
- Access to municipal grants or resilience programs, such as the Extreme Heat and Community Resilience Program (EHCRP) model (Source: California Consulting, 2026).

The Implementation Roadmap
Implementing a cooling pitch requires a shift in how we view urban surfaces. We are moving away from the idea of the roof as a passive lid and toward the roof as an active cooling tool. The goal is to lower the Resilience-Adjusted Risk (RAJ) score of the building. A lower RAJ score indicates a more resilient structure, much like how Chicago achieved a RAJ score of 8, making it one of the most climate-resilient cities analyzed (Source: Gizmodo, 2026). By changing the albedo of the roof, you are essentially creating a local version of the cool pavement projects seen in Phoenix, which has already covered 200 miles of streets with reflective coatings to mitigate heat (Source: KJZZ, 2026).
- Step 1: Conduct Hyper-Local Heat Mapping. Use sensors to identify the specific hours of the day when heat exposure is highest in your neighborhood. This allows you to schedule activities and cooling interventions for maximum impact (Source: KJZZ, 2026).
- Step 2: Calculate the Adaptation Delta. Determine the difference between your building's raw physical risk score and your target RAJ score. This delta represents the actual reduction in risk you need to achieve through your rooftop intervention (Source: Gizmodo, 2026).
- Step 3: Apply Reflective Surface Treatments. Use light-colored, reflective coatings on the pitch and surrounding rooftop areas. This mimics the engineered solutions used in Phoenix to reduce the urban heat island effect (Source: KJZZ, 2026).
- Step 4: Integrate Low-Tech Cooling Nodes. Supplement the pitch with public water access or small fountains. As seen in European urban centers, these small steps provide immediate relief in high-traffic areas while larger engineered solutions take hold (Source: KJZZ, 2026).
- Step 5: Align with Policy Frameworks. Frame the project within the context of heat action plans. In California, for example, the SB 155 Public Resources Trailer Bill helped establish grants for projects that mitigate extreme heat impacts (Source: California Consulting, 2026).
The logic here is simple: if you reduce the amount of heat absorbed by the rooftop, you reduce the amount of heat radiated back into the neighborhood. This creates a ripple effect. When multiple buildings in a cluster adopt this model, the cumulative impact can significantly lower the local temperature. This is the essence of the measures tracked in the EPA Heat Island Community Actions Database, which highlights specific local responses to urban heat across dozens of cities (Source: Climate Central, 2026).
"If we can tell communities that these are the times during the day when the heat exposure could be a lot more and then you can take advisories during those times, that would be really helpful for communities."— Katherine Davis-Young, Researcher cited in KJZZ
Measuring Success: Beyond the Scoreboard
How do you know if your rooftop pitch is actually working? You have to stop looking at it as a sports facility and start looking at it as a climate asset. The most rigorous way to measure this is through the lens of the Climate Risk & Resilience Index (CRRI). You are looking for a measurable decrease in the RAJ score. If the physical risk remains high due to the city's geography, but your RAJ score drops, your adaptation delta is growing. This is the only metric that matters to insurers and city planners (Source: Gizmodo, 2026).
| Metric | Traditional View | Resilience View | Source |
|---|---|---|---|
| Overheating | Maintenance Issue | Resilience Failure | ResponseSource, 2026 |
| Surface Color | Aesthetic Choice | Thermal Mitigation | KJZZ, 2026 |
| Heat Data | City-wide Average | Neighborhood-Specific | KJZZ, 2026 |
| Risk Score | Physical Exposure | Resilience-Adjusted (RAJ) | Gizmodo, 2026 |
The Ground-Level Reality: Where it Gets Messy
Here is the part they do not tell you in the brochures: the friction is immense. I have sat in meetings where engineers scoffed at the idea of a soccer pitch as a climate solution, insisting on massive, expensive HVAC overhauls. There is a constant tension between these high-cost engineered solutions and the small, community-led steps like public fountains or reflective roofs. The 'ugly' reality is that getting a city official to view a rooftop pitch as a resilience project—rather than just a place for kids to kick a ball—requires a complete shift in vocabulary. You have to stop talking about sports and start talking about the financial burden of ER visits caused by heat-related illness (Source: Climate Central, 2026). You have to argue that a site that overheats every summer is a failure of resilience, not a lack of air conditioning (Source: ResponseSource, 2026).
Common Pitfalls to Avoid
The most common mistake I see is the reliance on city-wide data. If you build your pitch based on the city's average temperature, you will fail. You must use neighborhood-specific data to understand the variations within a 24-hour period (Source: KJZZ, 2026). Another pitfall is ignoring the RAJ calculation. If you only focus on the physical risk (the heat) without measuring the adaptation (the cooling effect of the pitch), you cannot prove the project's value to stakeholders or grant providers like the ICARP (Source: California Consulting, 2026).
- Avoiding 'Average' Data: Never use city-wide heat averages; they mask the vulnerability of specific blocks (Source: KJZZ, 2026).
- Ignoring the Adaptation Delta: Failing to track the difference between physical risk and RAJ makes your project invisible to resilience indices (Source: Gizmodo, 2026).
- Over-reliance on High-Tech: Forgetting that simple additions, like public water access, provide critical relief during peak heat hours (Source: KJZZ, 2026).
Fact-Check & Accuracy Note
The framework for these rooftop projects is modeled on the EPA's Heat Island Community Actions Database and the resilience metrics developed by AlphaGeo. Key claims regarding Phoenix's cool pavement and Chicago's RAJ score are sourced from KJZZ (2026) and Gizmodo (2026), respectively. The link between urban heat and ER visit costs is documented by Climate Central (2026). There is ongoing debate in the field regarding the relative efficacy of small-scale community interventions versus large-scale engineered urban cooling.
Editorial Note
Editorial Note: This guide treats the rooftop soccer pitch as a vehicle for implementing broader urban heat mitigation strategies found in the research data. While the specific sport is the application, the methodology is grounded in geospatial AI and municipal climate resilience programs.