Chipmaker Pulls Back to Key Supportive Trendline
Source Entity
Yahoo Finance
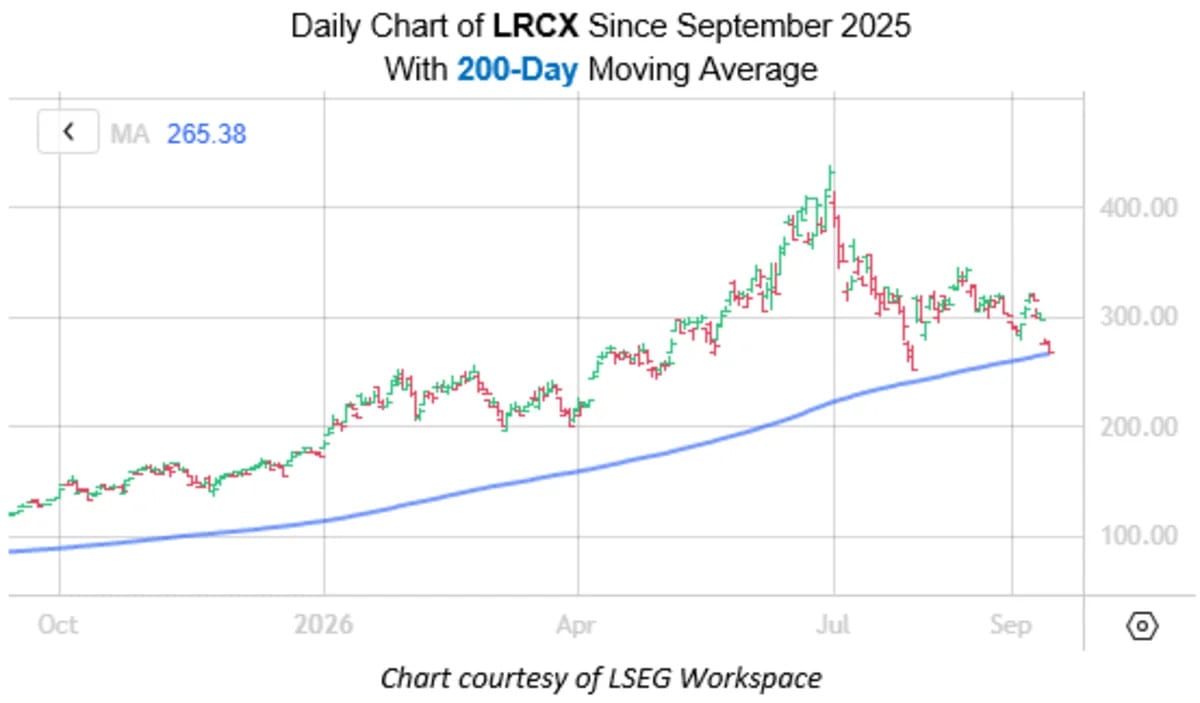
Lam Research Corporation (NASDAQ: LRCX) has experienced a significant 16.6% decline over the past week, pulling back from its June record highs. The stock is currently testing its 200-day moving average, a technical indicator that historically signals potential bullish reversals.
Market Overview: Lam Research Faces Technical Correction
Lam Research Corporation (NASDAQ: LRCX) is currently navigating a period of significant market volatility. After reaching a record high of $438.50 on June 30, the stock has faced downward pressure, culminating in a 16.6% decline over the last week. Despite this recent slump, the company retains a robust year-to-date performance, maintaining a 56% lead, which underscores the broader growth narrative that has defined the semiconductor equipment sector throughout the year.
The Significance of the 200-Day Moving Average
The recent price action has brought LRCX to a critical juncture: the 200-day moving average. In technical analysis, this trendline is widely regarded as a barometer for long-term sentiment. When a high-growth stock pulls back to this level, market participants often view it as a 'supportive trendline,' suggesting that the current sell-off may be reaching a floor rather than signaling a permanent shift in market structure.
Quantitative Analysis of Recent Trends
According to data from Schaeffer’s Senior Quantitative Analyst Rocky White, the current setup for LRCX is statistically significant. The stock has been trading within 0.75 times the 200-day moving average's 20-day average true range (ATR). This follows a period where the stock maintained strong momentum, spending 80% of the previous two weeks and 80% of the prior 42 trading sessions above this key technical marker.
Historical Precedents and Market Implications
Historical data provides a compelling lens through which to view this pullback. This specific technical setup—where a stock remains above the 200-day moving average for an extended period before pulling back to touch it—has occurred five other times over the last decade. Historically, such instances have often preceded periods of stabilization or renewed bullish momentum, providing a potential roadmap for investors attempting to time the market during periods of volatility.
Broader Market Context
The semiconductor industry remains a cornerstone of global technology infrastructure, and Lam Research serves as a critical supplier within this supply chain. While the recent 2.3% dip to $267.22 reflects broader market jitters, the company’s year-to-date gains demonstrate that its core business fundamentals have remained largely intact despite the recent correction. Investors continue to balance the company's long-term growth prospects against short-term macroeconomic headwinds.
Conclusion: Assessing Future Trajectory
In summary, while the 16.6% decline from the June peak is undoubtedly sharp, it should be viewed within the context of the stock's significant year-to-date appreciation. By testing the 200-day moving average, Lam Research is currently in a position that has historically signaled a potential pivot point. Whether the stock finds the necessary buying interest to rebound from this support level will be the primary focus for market analysts in the coming trading sessions.