Satellite Tracker – Live Map of Starlink and 30k Satellites
Source Entity
Hacker News
<a href="https://news.ycombinator.com/item?id=48901356">Comments</a>
The Visualization of Orbital Congestion: Analyzing the 30k Satellite Tracker
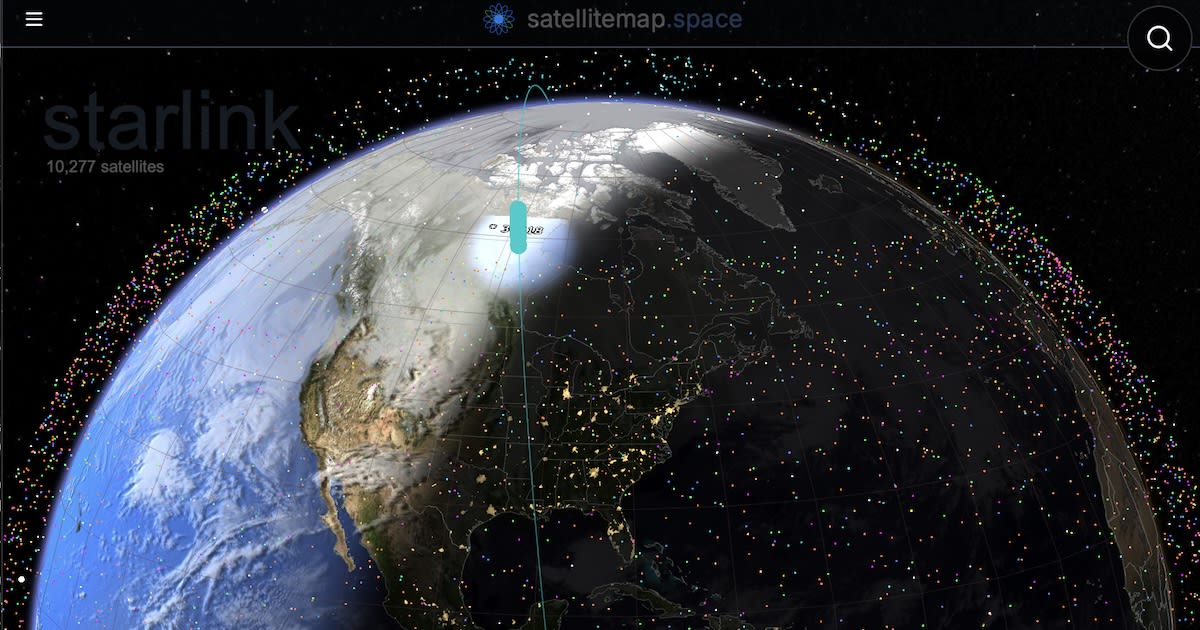
The emergence of a live map capable of tracking Starlink and over 30,000 satellites marks a significant moment in the public's understanding of the 'New Space' era. For decades, the view of space was dominated by a few dozen high-value government assets and the International Space Station. However, the current trajectory of commercial space deployment—led primarily by SpaceX's Starlink project—has fundamentally altered the composition of Low Earth Orbit (LEO). This tracking tool does more than provide data; it offers a visceral representation of the sheer scale of human-made objects now encircling our planet.
The Starlink Phenomenon and LEO Density
At the heart of this visualization is the Starlink constellation. SpaceX has aggressively pursued a strategy of deploying thousands of small satellites to provide global high-speed internet. Unlike traditional geostationary satellites that sit far above the Earth, Starlink satellites operate in LEO to minimize latency. This requires a massive 'shell' of satellites to ensure continuous coverage. When a tracker displays 30,000 objects, it underscores how the orbital environment is transitioning from a sparsely populated void to a crowded industrial zone. This shift is critical because as the number of active satellites grows, the probability of orbital collisions increases exponentially.
The Technical Foundation of Satellite Tracking
To achieve a live map of this scale, such tools typically rely on Two-Line Element (TLE) sets provided by agencies like NORAD and the U.S. Space Command. TLEs are data formats that describe the orbit of an object at a specific point in time. By applying Keplerian orbital mechanics, the tracker can predict the current position of a satellite with high accuracy. The ability to render 30,000 points of data in real-time on a web interface represents a triumph of modern frontend visualization and data processing, allowing users to see the 'trains' of Starlink satellites shortly after launch before they disperse into their final orbits.
Implications for Astronomy and Space Sustainability
While global connectivity is a clear benefit, the visualization of 30,000 satellites brings to light the growing tension between commercial interests and scientific research. Astronomers have repeatedly raised alarms regarding 'light pollution' in the night sky, where bright satellite streaks interfere with long-exposure deep-space photography. The visual density shown on this map correlates directly to the challenges faced by ground-based observatories. Furthermore, the sheer volume of objects increases the risk of the Kessler Syndrome—a theoretical scenario where one collision creates a cloud of debris that triggers a chain reaction of further collisions, potentially rendering LEO unusable for generations.
The Competitive Landscape of Mega-Constellations
The tracker's current count of 30,000 is likely just the beginning. While Starlink currently dominates, other players are entering the fray. Amazon's Project Kuiper is poised to launch thousands of its own satellites, and various national projects in China and the EU are planning similar constellations. This 'space race' for connectivity means that the live map will need to scale even further. The competition is not just about market share, but about 'orbital real estate,' as certain altitudes and inclinations are more desirable for coverage than others.
Predictive Trends in Space Traffic Management
Looking forward, the availability of such tracking tools suggests a growing need for a standardized, international Space Traffic Management (STM) system. Much like Air Traffic Control manages the skies, the orbital community will require a coordinated system to prevent collisions. We can expect to see more sophisticated tools that integrate AI to predict 'conjunction events' (near-misses) and automate avoidance maneuvers. The transition from simple visualization to active management will be the next logical step in ensuring the sustainability of the orbital environment.
Summary of Findings
In conclusion, the Satellite Tracker providing a live map of 30,000 objects is a powerful educational and analytical tool. It exposes the reality of our increasingly crowded orbit and the dominance of commercial constellations like Starlink. While these satellites promise to bridge the digital divide, the visual evidence of orbital density serves as a stark reminder of the need for sustainable space practices and international cooperation to prevent the tragedy of the orbital commons.