Wet soil reeks of iron. In Chiayi County, water and soil samples from eight rice fields yielded 1.01 million usable DNA sequencing reads to map ephemeral wetland vulnerabilities (Source: Taipei Times, 2026). This process strips the biological identity from the environment, turning a handful of mud into a ledger of every arthropod and pest that breathed near the site. The data shows 93 percent of these reads matched arthropods, including stem borers and planthoppers, while nearly 6 percent identified other taxa (Source: Taipei Times, 2026). It is a clinical extraction of presence, removing the need for physical capture.
Operational Prerequisites
Fieldwork requires more than a sample jar. The operator needs a kit capable of capturing genetic material filtered at a scale less than 1/200th of the width of a human hair, a standard for excluding the smallest bacteria since the 1960s (Source: Taipei Times, 2026). Once the biological slurry is collected, the heavy lifting occurs on silicon-etched servers and fiber-optic networks. Access to the GenBank database, maintained by the US National Institutes of Health, is mandatory for matching sequence reads to known species (Source: Taipei Times, 2026). Without this reference library, the sequence is merely a string of meaningless nucleotides.
- High-flow-rate eDNA sampling modules (for deep ocean deployment)
- Fine-mesh filtration units (< 1/200th human hair width)
- Sterilized sediment core samplers for seabed audits
- Computational access to GenBank (US NIH) and R version 4.3.2
- The vegan package (version 2.6.4) for data rarefaction
The Extraction Workflow
Execution is a matter of strict contamination control. Any skin cell or LED-bleached laboratory residue can corrupt a sample, leading to false positives in high-sensitivity metabarcoding. The process involves capturing genetic material shed through feces, urine, feathers, spores, or pollen (Source: UA.NEWS, 2026). Once the sample is secured, the operator moves from the mud to the machine.
- Collect water or sediment samples from the target zone (e.g., Feitsui Reservoir or Scottish seabed).
- Filter the sample through high-density membranes to trap eDNA while excluding microscopic debris.
- Extract the genetic material and generate sequencing reads via high-throughput metabarcoding.
- Standardize sequencing depth across all samples using the 'rarefy' function in the vegan package (version 2.6.4) in R (version 4.3.2) (Source: Scientific Reports, 2026).
- Compare the processed reads against GenBank to determine the presence or absence of specific genera (Source: Scientific Reports, 2026).
- Cross-reference eDNA findings with traditional capture data to identify gaps in native or invasive species detection.
The difference between these results and traditional methods is staggering. In the Feitsui Reservoir of New Taipei, traditional capture methods documented 23 fish species, but eDNA analysis detected those 23 plus an additional 13 species (Source: Taipei Times, 2026). This gap exists because traditional nets are biased toward large-bodied, invasive taxa, whereas metabarcoding favors native and small-bodied species (Source: Taipei Times, 2026). The molecular dragnet finds what the net misses.
"Metabarcoding demonstrates both time and cost efficiency compared to older sampling methods, but it’s not without its drawbacks."— Lin's Team, Taiwan Ocean Research Institute
Operational speed is the primary driver for regulatory adoption. The Scottish Environment Protection Agency (SEPA) has integrated eDNA from sediment samples to check seabed compliance around salmon farms (Source: Salmon Business, 2026). By measuring changes in bacterial communities, SEPA has slashed the turnaround time for compliance checks from 16 weeks down to just six (Source: Salmon Business, 2026). This allows operators to bypass the greasy, time-consuming process of manually identifying and counting seabed organisms when standards are met.
| Metric | Traditional Capture | eDNA Metabarcoding |
|---|---|---|
| Species Detected (Feitsui) | 23 | 36 (23 matched + 13 additional) |
| Target Bias | Large-bodied, Invasive | Native, Small-bodied |
| Turnaround (Scotland) | 16 Weeks | 6 Weeks |
| Detection Method | Visual/Physical Capture | Genetic Sequence Matching |
Oceanic deployment introduces the variable of drift. In Japan, large-scale marine eDNA databases have revealed seasonal latitudinal diversity gradients driven by vagrant fish (Source: Scientific Reports, 2026). The data indicates that richness metrics often reflect transient ecological processes rather than stable community structures (Source: Scientific Reports, 2026). Warm periods often show a temporary inflation of richness driven by non-resident taxa, a phenomenon that could be amplified by ongoing climate warming (Source: Scientific Reports, 2026).
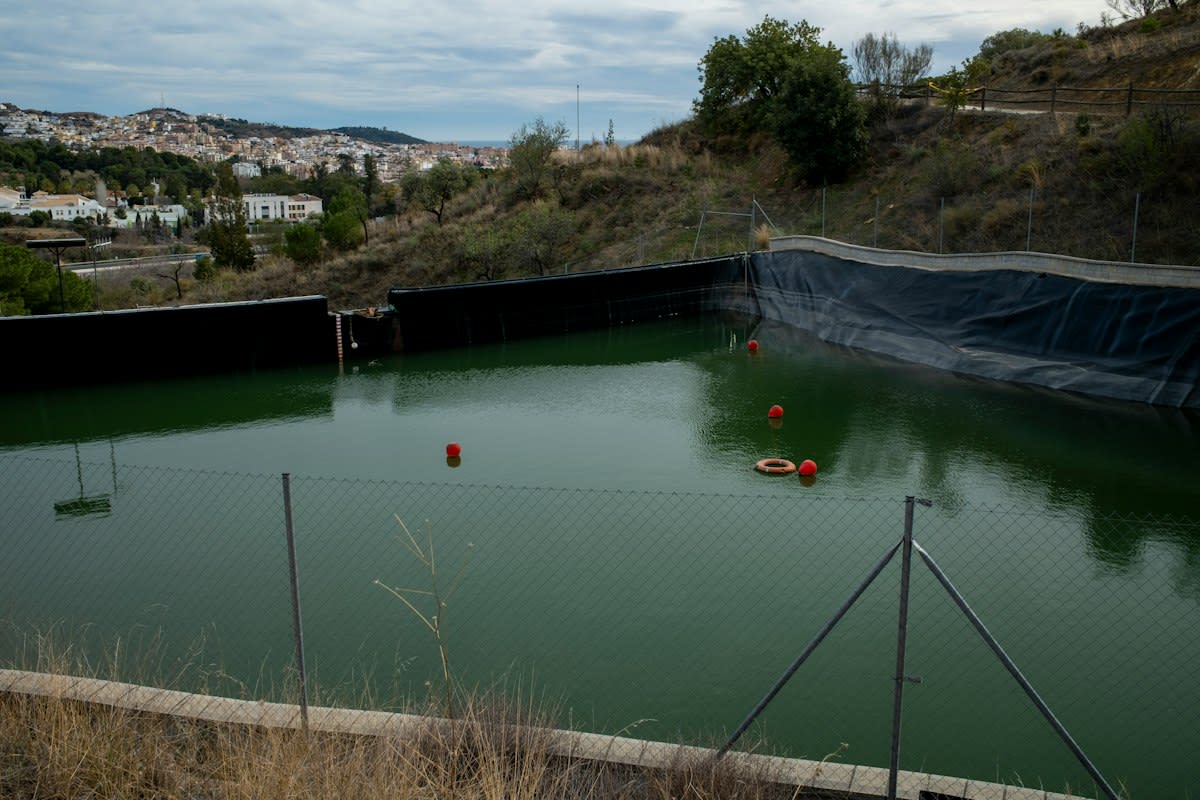
From the operator's perspective, the friction is found in the discrepancy between the map and the mud. There is a constant debate in the field regarding the validity of a 'detection' when no physical specimen exists. In New Taipei, eDNA detected the Florida or largemouth bass (Micropterus salmoides) and the blue tilapia exclusively, leaving ecologists to wonder if these invasive species are actively thriving or if their genetic ghosts are simply drifting through the current (Source: Taipei Times, 2026). This is the reality of the work: staring at a screen of sequence reads while the actual fish remain invisible in the depths.
Critical Failure Points
eDNA is not an infallible oracle. The integrity of the sample is under constant assault from environmental degradation factors. Ultraviolet (UV) radiation and microbial activity accelerate the rate at which DNA breaks down, potentially erasing the presence of a species before the operator even arrives (Source: Taipei Times, 2026; UA.NEWS, 2026). Furthermore, the amount of DNA shed varies wildly based on an organism's life stage, activity level, and stress levels (Source: Taipei Times, 2026).
Hydrology creates a spatial distortion. Running water and currents can carry genetic material far from the source organism, making it difficult to infer the exact community structure of a specific location (Source: Taipei Times, 2026; UA.NEWS, 2026). A detection in a downstream sample does not guarantee a resident population; it may simply be the oxidized residue of a fish that passed through kilometers away. This spatial lag is the primary failure point in precision biodiversity mapping.
Fact-Check & Accuracy Note
Verify all reads against the GenBank database and apply the 'rarefy' function in R to control for differences in sequencing effort. Failure to standardize depth leads to inflated richness metrics, especially during seasonal warm periods (Source: Scientific Reports, 2026).
Editorial Governance
Editorial Note: This guide is based on empirical data from 2026 reports. The transition from traditional capture to eDNA is driven by a need for speed in regulatory compliance (as seen with SEPA) and the detection of small-bodied native species that avoid traditional nets.