Most amateur athletes operate on a dangerous binary: they are either under-training or pushing toward a catastrophic failure. The gap between these two states is where professional performance lives, yet it remains invisible to those relying on intuition. In high-performance environments, such as the elite running camps in Iten, Kenya, or the professional futsal academies of Sao Paulo, training is not a matter of willpower but of mathematics. They treat the human body as a biological system with a specific capacity for stress, measuring the exact point where adaptation turns into degradation.
The fundamental flaw in amateur programming is the obsession with external load—the miles run, the kilos lifted, or the hours spent on the pitch. These metrics are vanity numbers. They describe what the athlete did, but not how the athlete responded. A 10-mile run for a rested athlete is a recovery session; for an athlete struggling with systemic fatigue and poor sleep, that same 10-mile run is a physiological stressor that can trigger an overuse injury. Professional load management bridges this gap by quantifying the internal response to an external stimulus.
The Load Management Toolkit
Before calculating ratios, you must establish a data collection pipeline. Without a consistent way to capture both objective and subjective data, any load management system is merely a guessing game. You do not need a full sports science lab, but you do need tools that provide high-resolution snapshots of your physiological state. The goal is to create a feedback loop where today's data dictates tomorrow's intensity.
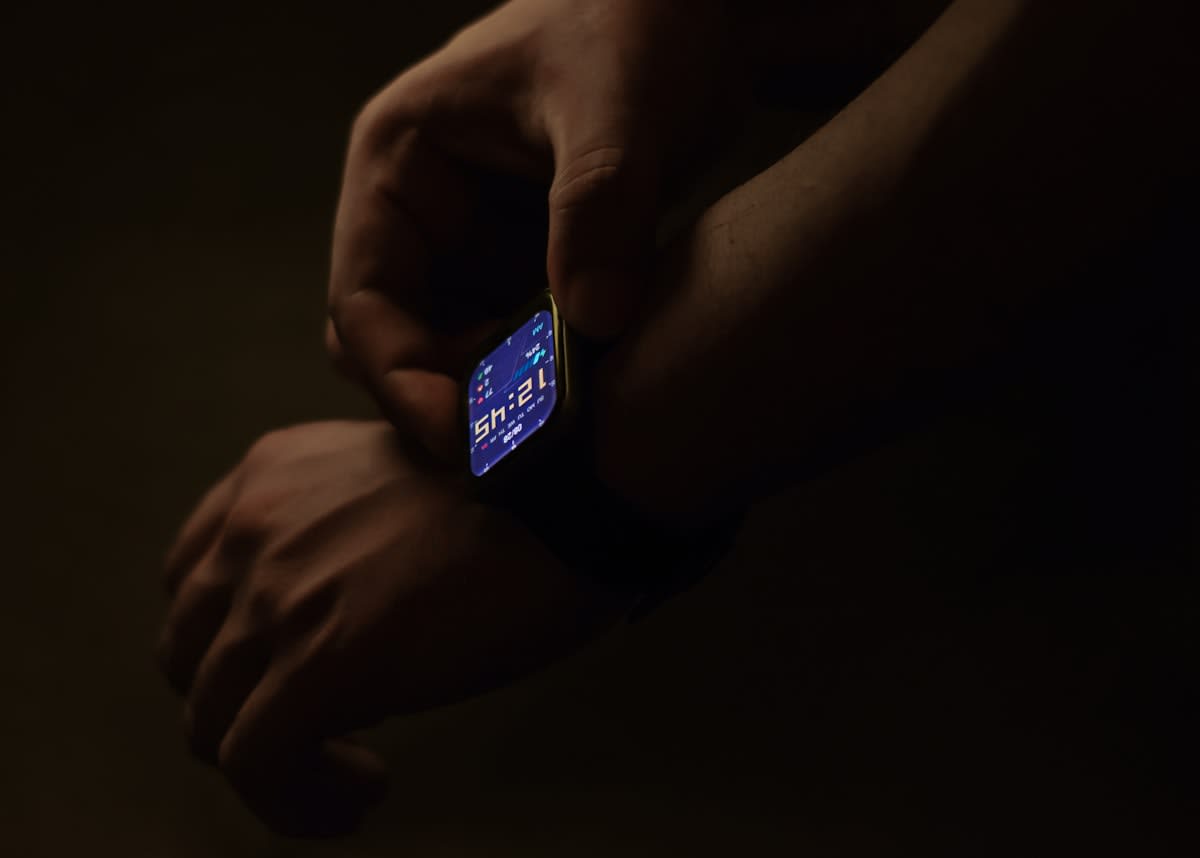
- Biometric Wearable: A device capable of tracking Heart Rate Variability (HRV) and resting heart rate (RHR) to monitor autonomic nervous system status.
- Training Log: A digital ledger (Spreadsheet or specialized app) to record duration, intensity, and volume for every session.
- Subjective Wellness Scale: A daily 1-5 rating system for sleep quality, muscle soreness, and stress levels.
- RPE Scale: A standardized 1-10 Rate of Perceived Exertion scale to quantify the internal cost of each workout.
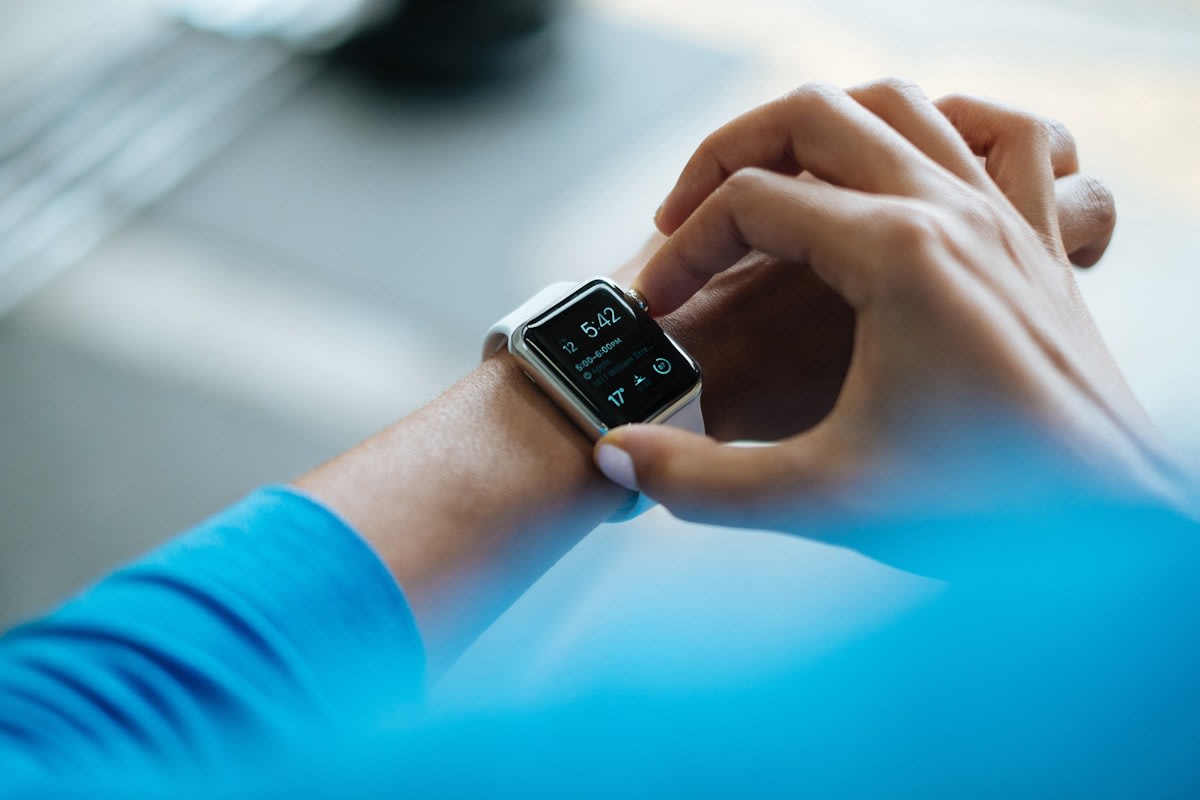
The integration of these tools allows an athlete to see the delta between their planned workout and their actual physiological cost. For instance, if a session is planned at a moderate intensity but the athlete's RPE is an 8 and their HRV has dropped by 15% from their 7-day rolling average, the system signals a mismatch. This is the precise moment where an amateur would typically 'push through,' and a professional would pivot to a recovery protocol.
Building the System
- Establish Your Baseline: Spend 14 days recording your resting heart rate and HRV upon waking. This creates a normative range. Any deviation of more than one standard deviation from this mean indicates a state of non-functional overreaching.
- Quantify External Load: Calculate the 'Training Load' for every session. The simplest professional formula is Duration (minutes) x RPE (1-10). A 60-minute run at an RPE of 7 equals a load of 420 units.
- Track the Acute Load: Sum the total training load for the current 7 days. This represents the immediate stress placed on the body and is your 'Acute Workload'.
- Track the Chronic Load: Calculate the average of your weekly loads over the previous 28 days. This represents your developed fitness and capacity, known as your 'Chronic Workload'.
- Calculate the Acute:Chronic Workload Ratio (ACWR): Divide the Acute Load by the Chronic Load. This ratio tells you if you are increasing volume too quickly or stagnating.
- Adjust Training Based on the Ratio: If your ACWR is between 0.8 and 1.3, you are in the 'sweet spot' for adaptation. If the ratio exceeds 1.5, you have entered the 'danger zone' where injury risk increases significantly.
Why does the 28-day window matter? The body does not adapt to stress instantly; it requires a cumulative build-up to strengthen tendons and ligaments. By comparing the last week to the last month, you are essentially measuring the current stress against your current durability. An athlete who jumps from a chronic average of 2,000 units per week to an acute load of 4,000 units is effectively asking their body to perform at 200% of its capacity, a recipe for stress fractures or soft tissue tears.
The Individuality Principle
The 'Sweet Spot' is not a static number. While 0.8 to 1.3 is the general industry standard, some athletes may thrive at 1.4, while others see a spike in injury at 1.2. The goal is to find your personal threshold through consistent tracking.
To make this operational, the athlete must implement a daily triage. Every morning, check the HRV and wellness scores. If the metrics are green, proceed with the planned load. If they are yellow, reduce the intensity by 20% or swap a high-impact session for a low-impact alternative. If they are red, the session is replaced with active recovery or total rest. This removes the emotional guilt associated with missing a workout and replaces it with a data-backed decision.

The Mathematics of Recovery
| ACWR Range | Status | Physiological Meaning | Action Required |
|---|---|---|---|
| 0.0 - 0.8 | Under-training | Detraining or excessive recovery | Gradually increase volume |
| 0.8 - 1.3 | Optimal | Fitness gain with manageable risk | Maintain current trajectory |
| 1.3 - 1.5 | Over-reaching | High stress, potential for fatigue | Monitor wellness closely |
| 1.5+ | Danger Zone | High risk of injury/burnout | Immediate load reduction |
It is critical to understand that 'load' is not just physical. Psychological stress—work deadlines, relationship strain, or travel—consumes the same systemic resources as a heavy squat session. A professional system integrates these factors. If an athlete is facing a high-stress week at work, their capacity to handle a high ACWR drops. In these instances, the 'optimal' range may shift downward to 0.8-1.1 to avoid pushing the system into a state of total collapse.
Common Pitfalls
The most frequent error is the 'Data Obsession Trap,' where athletes become so tethered to their wearable that they ignore blatant physical warning signs. If your HRV says you are recovered, but your Achilles tendon is throbbing, the tendon wins. Data is a tool for guidance, not a replacement for somatic awareness. The system should augment your intuition, not override it.
Another failure point is the linear progression fallacy. Many amateurs believe that load must increase every single week to produce results. This is biologically impossible. The body requires periods of deliberate unloading—typically every fourth week—where the acute load is intentionally dropped to 60-70% of the chronic average. This 'deload' phase is where the actual adaptation occurs, as the body repairs the micro-trauma accumulated during the build phase.
Finally, athletes often miscalculate RPE by confusing 'discomfort' with 'effort.' A high-intensity interval session is uncomfortable, but if the athlete's heart rate remains low and their form is crisp, the internal load may be lower than a long, slow slog that leaves them mentally exhausted. Precision in RPE requires a honest assessment of the total systemic cost of the session, not just the burning sensation in the muscles.