The S&P 500 is testing a key technical floor. Is it time to buy, or brace for a bear market?
Source Entity
Joseph Adinolfi
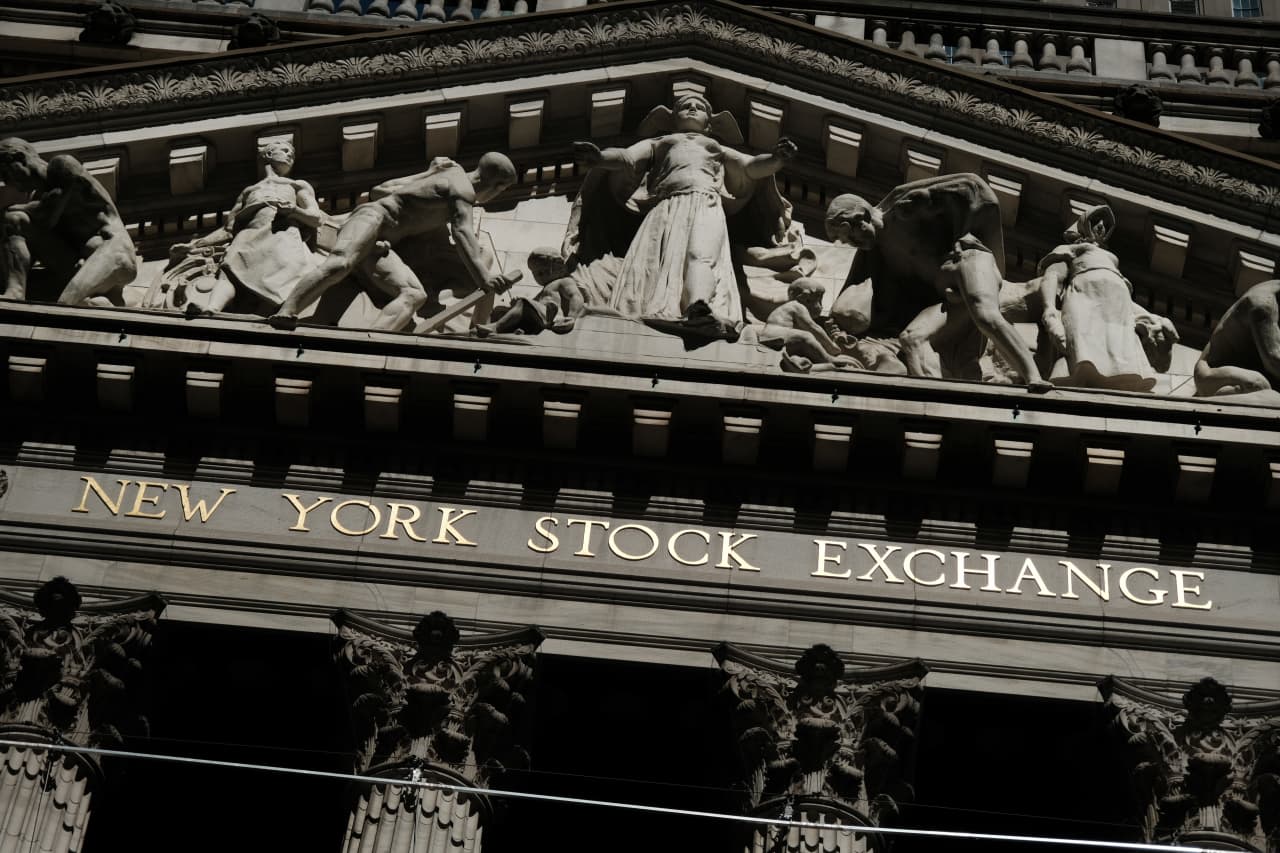
The S&P 500 has fallen below its 200-day moving average, signaling potential bearish momentum. This downturn is largely linked to a cooling in the previously high-flying artificial intelligence sector.
Market Volatility and the 200-Day Threshold
The financial landscape is currently defined by a significant technical shift as the S&P 500 drops below its 200-day moving average. In technical analysis, this specific moving average is widely regarded by institutional investors as the definitive line between a long-term bull market and a potential bear market. When major equity indices breach this level, it often triggers algorithmic selling and signals a shift in market sentiment from 'buy the dip' to 'sell the rally.'
The Cooling of the AI Trade
The primary catalyst for this current downward pressure is the stagnation of the artificial intelligence sector. For much of the recent cycle, AI-related stocks have served as the primary engine for market growth, driving valuations to historic highs. However, as the initial fervor subsides, investors are beginning to scrutinize the actual revenue realization and long-term profitability of these massive capital expenditures. This skepticism has caused a rotation out of tech-heavy growth stocks, dragging the broader index down with them.
Broader Implications of Equity Index Correlation
It is critical to note that the S&P 500 is not acting in isolation; it is moving in tandem with other major U.S. equity indices. This synchronized decline suggests that the weakness is not localized to a single sector or niche, but rather reflects a systemic reassessment of risk. When multiple benchmarks fail to hold their technical floors simultaneously, it usually indicates that institutional portfolios are undergoing a broad-based de-risking process to protect capital against further volatility.
Historical Context and Technical Significance
Historically, trading below the 200-day moving average is a warning sign that macroeconomic headwinds—such as interest rate uncertainty or shifting growth expectations—are beginning to outweigh the optimism of equity bulls. While past performance is no guarantee of future results, previous instances of sustained trading below this average have often preceded periods of prolonged market consolidation. Investors are now forced to weigh whether this is a temporary correction or the beginning of a deeper cyclical downturn.
Future Trends and Investor Outlook
The path forward depends heavily on whether market leaders can regain momentum or if the current technical breakdown will invite further selling pressure. If the index fails to reclaim this key level quickly, the narrative may shift toward defensive positioning, with capital flowing into bonds or cash equivalents. Investors should monitor whether the AI sector finds a new floor or if the broader market continues to succumb to the weight of high valuations in an increasingly uncertain economic climate.
Verification Required?