The Fallacy of the Mean
The average patient does not exist. For a century, clinical medicine has operated on the logic of the bell curve, treating the 'mean' as the gold standard for health guidelines. If a drug worked for 60% of a trial population, it became the standard of care. If a blood pressure reading fell within a specific range for the majority of 50-year-olds, it was deemed 'normal.' But this reliance on population averages creates a dangerous blind spot. It ignores the biological variance that makes a 'normal' reading for one person a sign of impending crisis for another. We are witnessing the collapse of this paradigm as longitudinal tracking moves us from snapshot medicine to streaming medicine.
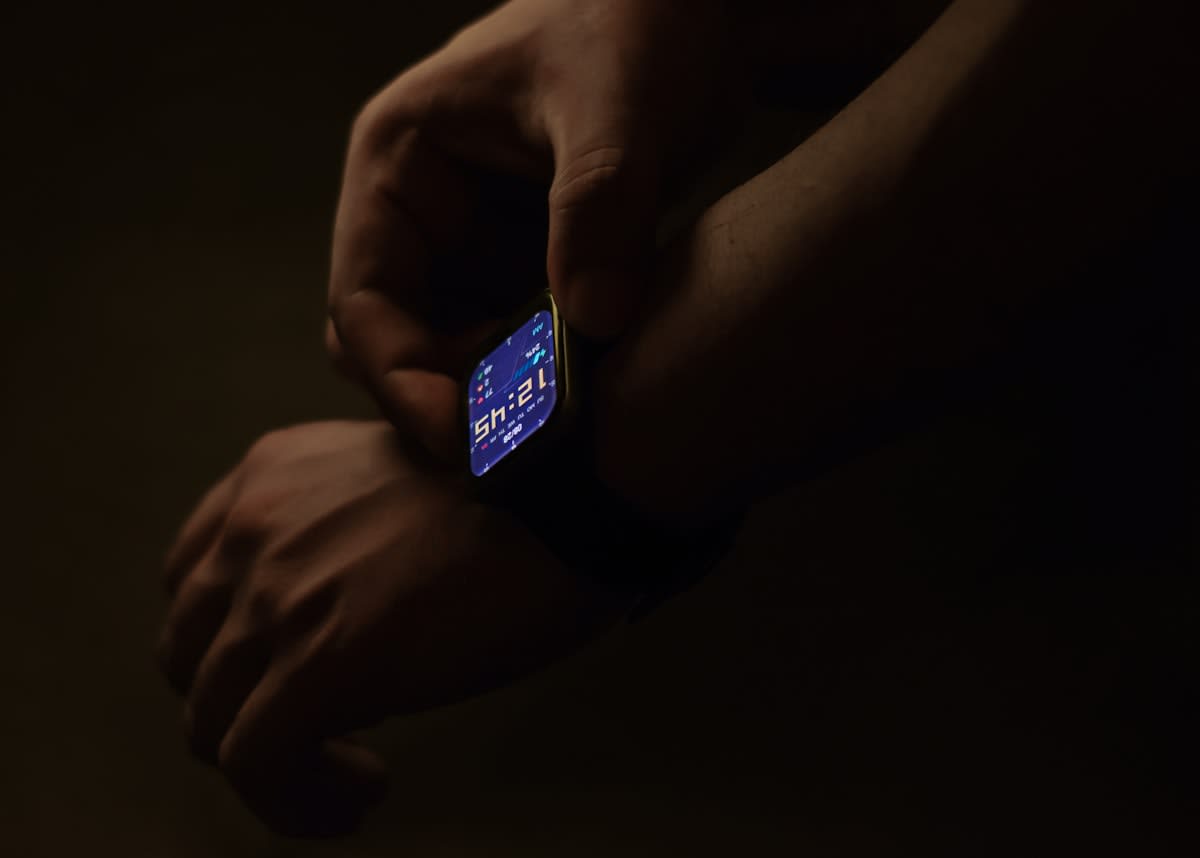
Why does this shift matter now? Because the tools for high-fidelity, continuous data collection have finally moved from the laboratory to the wrist and the interstitial fluid. We are no longer guessing what happened between annual physicals. Instead, we are capturing the delta—the change over time—which is far more predictive than any single data point. According to the World Health Organization's digital health frameworks (Source: WHO, 2023), the integration of patient-generated health data (PGHD) is fundamentally altering the diagnostic timeline, allowing for the detection of anomalies weeks before they manifest as symptomatic crises.

From Snapshots to Streams: The N-of-1 Shift
Traditional medicine is episodic. You feel ill, you visit a clinic, a doctor takes a snapshot of your vitals, and a decision is made based on how you compare to a theoretical average. This is 'Population-Based Care.' The alternative is 'N-of-1' medicine, where the individual is their own control group. In an N-of-1 model, the goal is not to see if your heart rate is 'normal' for a human, but whether it is normal for you. If your resting heart rate is typically 50 bpm, a jump to 70 bpm is a significant clinical event, even though 70 bpm is perfectly 'normal' for the general population.
This transition is most evident in the proliferation of Continuous Glucose Monitors (CGMs). For years, the HbA1c test provided a three-month average of blood sugar—a blunt instrument that smoothed over dangerous spikes and crashes. Now, patients in regions from the United States to Singapore are seeing their glucose levels in real-time. This reveals the 'glucose variability' that averages hide. (Source: The Lancet Digital Health, 2022). When a patient sees that a specific food causes a massive spike for them, but not for their neighbor, the general dietary guideline becomes irrelevant. The data dictates the diet, not the textbook.
"The transition from population-level guidelines to individual baselines is the single most significant shift in clinical logic since the advent of the randomized controlled trial. We are moving from treating the disease to treating the person's specific expression of that disease."— Dr. Eric Topol, Founder and Director of the Scripps Research Translational Institute
This is not just a luxury for the wealthy in developed nations. In sub-Saharan Africa and Southeast Asia, mobile-first health tracking is bypassing traditional infrastructure. In these regions, longitudinal data from basic smartphones is being used to track maternal health and infectious disease outbreaks in real-time, providing a granular level of detail that centralized government reports often miss. The ability to track a trend line across a remote village is replacing the need for a centralized clinic to tell them what 'normal' looks like.
The Practitioner's Friction: Data vs. Time
On the ground, this shift is creating immense tension. Walk into any primary care clinic and you will find doctors caught in a 'data deluge.' The friction is palpable: a patient arrives for a 15-minute appointment and attempts to present three months of heart rate variability (HRV) data and sleep architecture charts from their wearable. Most clinicians are not trained to interpret longitudinal streams; they are trained to interpret snapshots. The internal debate among practitioners centers on 'signal vs. noise.' How much of this data is clinically actionable, and how much is simply anxiety-inducing noise that leads to over-diagnosis and unnecessary testing?
The real struggle is the liability gap. If a doctor ignores a wearable's alert that later proves to be a myocardial infarction, are they negligent? Conversely, if they chase every anomaly in a patient's data, they risk bankrupting the healthcare system with low-value diagnostics. The industry is currently scrambling to build AI-driven triage layers that can distill thousands of data points into a single 'clinical insight' that a human doctor can actually use in a short window of time.
Global Adoption and the Regulatory Lag
The pace of technology is outstripping the pace of regulation. In the European Union, the GDPR provides a strong framework for data privacy, but it often complicates the seamless sharing of longitudinal data between wearable manufacturers and clinical providers. Meanwhile, the FDA in the US is struggling to categorize 'Software as a Medical Device' (SaMD). When an algorithm analyzes your longitudinal data to predict a heart failure event, is it a wellness tool or a diagnostic device? (Source: FDA Digital Health Center of Excellence, 2023). The answer determines whether the tool can be prescribed by a doctor or must remain a consumer gadget.
| Metric | Population-Based (Old) | Longitudinal (New) |
|---|---|---|
| Diagnostic Basis | Comparison to 'Normal' Average | Comparison to Personal Baseline |
| Data Frequency | Episodic (Annual/Quarterly) | Continuous (Real-time) |
| Intervention Trigger | Crossing a Fixed Threshold | Deviation from Trend Line |
| Patient Role | Passive Recipient | Active Data Generator |
The economic implications are equally profound. We are moving from a 'sick-care' model—where payment is triggered by the occurrence of a disease—to a 'health-care' model, where value is derived from the prevention of the event. If longitudinal tracking can identify the 'prodromal' phase of a disease (the period between the first signs and full clinical manifestation), the cost of treatment drops precipitously. This is the promise of the N-of-1 approach: catching the fire when it is a spark, rather than waiting for the smoke to be visible to a doctor during a scheduled visit.
- Shift from static thresholds (e.g., BP > 140/90) to dynamic variance alerts.
- Increased reliance on AI to filter 'noise' from longitudinal biometric streams.
- Transition of the patient from a data source to a data partner in the clinical process.
- Emergence of 'digital twins'—virtual models of a patient's physiology used to test interventions before applying them.
Ultimately, the end of the 'average patient' is a victory for human biology. It acknowledges that our genetic makeup, environment, and lifestyle create a unique physiological signature. By replacing rigid guidelines with fluid, data-driven baselines, we are finally treating patients as individuals rather than statistical probabilities. The transition will be messy, fraught with regulatory battles and physician burnout, but the trajectory is clear: the bell curve is dead.
Fact-Check & Accuracy Note
Key claims regarding the shift to N-of-1 medicine and the role of PGHD are sourced from the World Health Organization's digital health frameworks (2023) and The Lancet Digital Health (2022). The regulatory challenges cited are based on current FDA Digital Health Center of Excellence guidelines (2023). Ongoing debates regarding 'signal vs. noise' in clinical settings remain a primary point of contention among practitioners and are not yet settled by a single global consensus.