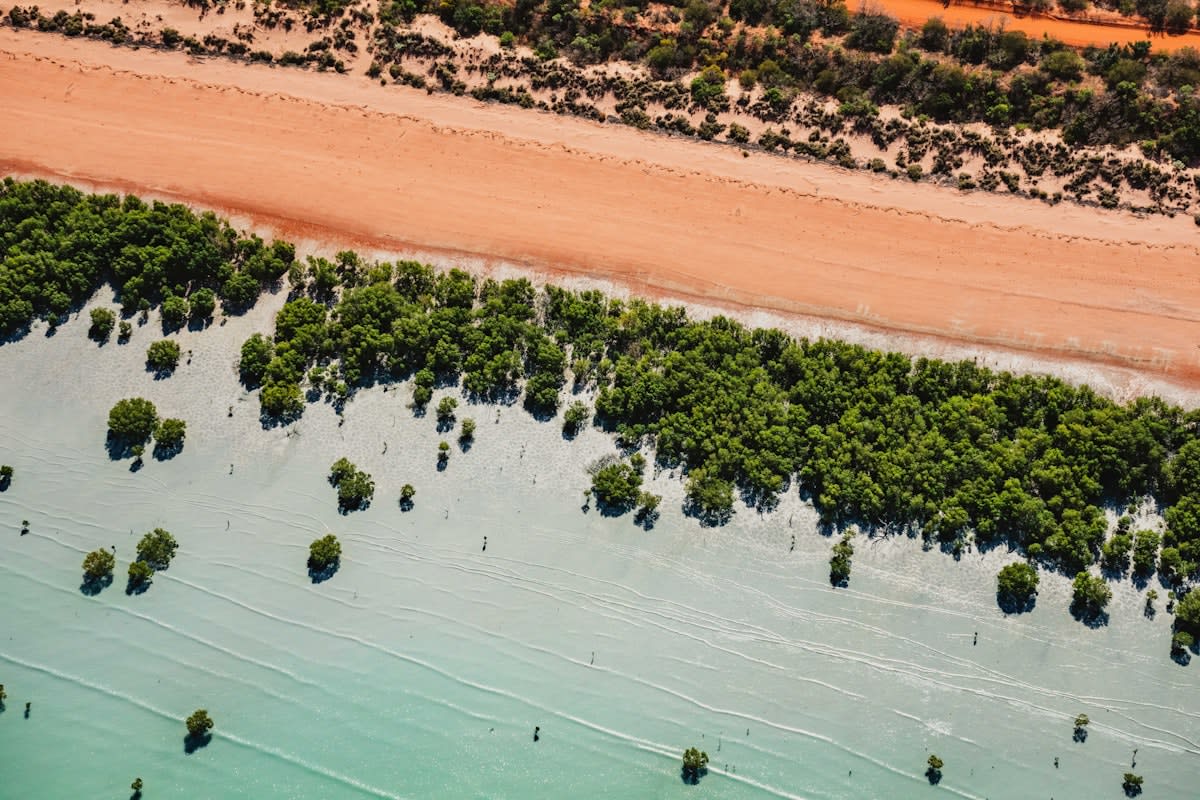
Can we actually trust the carbon credits being traded in global markets? For too long, nature-based solutions relied on coarse estimations that ignored the volatile reality of coastal ecosystems. The shift toward high-resolution remote sensing and Geographic Information Systems (GIS) transforms this process from a guessing game into a rigorous audit. By integrating spatial multi-criteria analysis, practitioners can now distinguish between stable carbon sinks and areas prone to rapid degradation, ensuring that sequestration claims are grounded in biophysical reality rather than optimistic projections.
Execution Prerequisites
Before deploying high-resolution sensors, a practitioner must establish a data environment capable of handling multi-decadal land-use changes. The ability to synthesize biophysical and socio-economic variables is what separates a basic map from a decision-support tool. This requires a combination of historical land-cover data and current high-resolution imagery to identify trends in stability and instability across the landscape.
- Remote sensing datasets (High-resolution Lidar or multispectral imagery)
- GIS-based assessment software for spatial multi-criteria analysis
- PAP/RAC stability framework for humid tropical coastal settings
- Historical land-use/land-cover records (minimum 30-year window, e.g., 1985–2024)
- Soil temperature and microbial activity baselines
Why focus on the 1985–2024 window? As demonstrated in studies of southeastern Brazil, specifically in Rio de Janeiro State, establishing empirical linkages between land-use change and observed degradation patterns is the only way to validate long-term carbon stability. Without this temporal depth, a high-resolution snapshot is merely a picture, not a proof of sequestration. Precision requires the synthesis of current stability status with historical degradation risk.
Practical Application Workflow
- Define the geospatial boundary using high-resolution imagery to isolate mangrove clusters from adjacent agricultural frontiers.
- Apply a spatial multi-criteria analysis to categorize the landscape into stable and unstable classes, utilizing frameworks like PAP/RAC.
- Quantify the spatial distribution of these classes to determine the percentage of the landscape that can reliably sequester carbon without risk of sheet erosion.
- Integrate soil carbon data to identify hidden climate threats, specifically the risk of microbial breakdown of stable carbon as temperatures rise.
- Calculate the total carbon removal potential in tonnes to align with high-integrity credit requirements, such as those seen in the Sulawesi reforestation projects.
- Develop a conservation priority map that synthesizes stability status with socio-economic variables to ensure the longevity of the sequestration site.
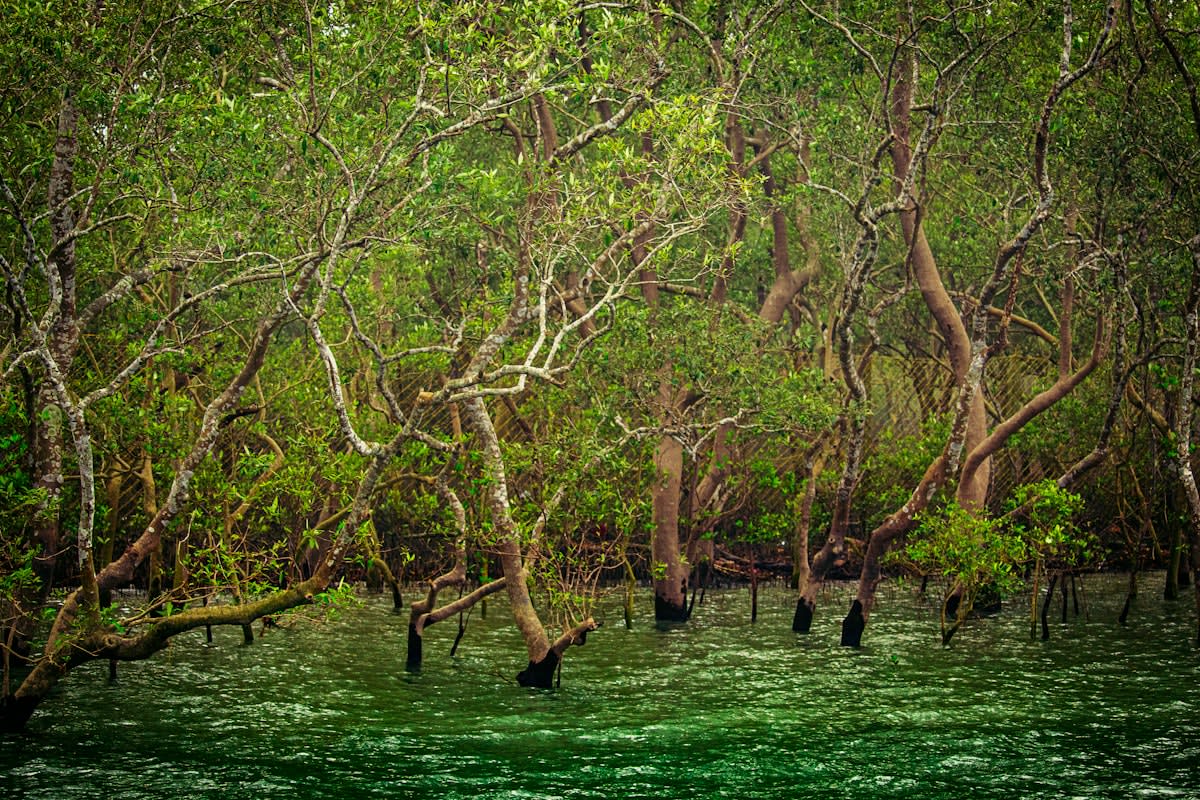
The core of this process lies in the quantification of stability. In the Rio de Janeiro State study, researchers found that 68.4% of the landscape remained stable, while 7.8% was unstable, with sheet erosion concentrated heavily at agricultural frontiers. For a carbon mapper, these percentages are critical. Stable areas represent the primary sequestration engine, whereas unstable zones are liabilities that can flip from carbon sinks to carbon sources in a single season.
The Stability Paradox
A 37-year soil warming experiment in the Harvard Forest revealed that warming causes microbes to break down stable soil carbon previously thought to be protected. This releases additional CO2, meaning high-resolution mapping must account for the risk that 'stable' carbon may not remain so under rising temperatures.
This biological volatility directly impacts the valuation of carbon credits. When firms like Google and McKinsey commit to forward offtakes—such as the 335,000 tonnes of carbon removal from Thryve.Earth projects in Sulawesi, Indonesia—they are betting on the integrity of the mapping. If the mapping fails to account for soil instability or microbial carbon release, the financial instrument becomes worthless. High-resolution Lidar and GIS are the only tools capable of providing the necessary volume and price certainty for these multi-million dollar deals.
| Landscape Class | Stability Percentage (Brazil Study) | Carbon Sequestration Risk | Management Priority |
|---|---|---|---|
| Stable | 68.4% | Low | Maintenance & Monitoring |
| Unstable | 7.8% | High (Sheet Erosion) | Immediate Intervention |
| Transition/Frontier | Remaining % | Moderate | Buffer Zone Creation |
The financial mobilization for these projects often mirrors industrial transitions in other sectors. In Viet Nam, for instance, the alignment of industrial expansion with green investment goals provides a template for how carbon mapping can attract large-scale finance. By transforming a coastal mangrove forest into a quantifiable, low-risk asset through geospatial precision, developers can mobilize the same type of capital that funds low-carbon industrial clusters.

Common Pitfalls
The most frequent error in carbon mapping is the failure to distinguish between upfront carbon and long-term stability. Much like the embodied carbon targets in the UK built environment—where Higher Education projects achieve 128 kgCO2e/m2 against a target of 144 kgCO2e/m2—carbon sequestration must be measured against a strict, transparent standard. Mapping that ignores the 'leakage' of carbon through microbial breakdown or sheet erosion provides a false sense of security.
Another critical failure is the reliance on static data. The environment is dynamic; a region that is stable today may become unstable as agricultural frontiers expand. Practitioners must employ continuous geovisualization and spatial decision-support tools to update their stability maps. If the mapping is not iterative, it cannot support the ten-year forward offtake agreements required by major corporate buyers like Tencent or Google.