Corning Stock Signal Hints at Upside Potential Amid Breather
Source Entity
Yahoo Finance
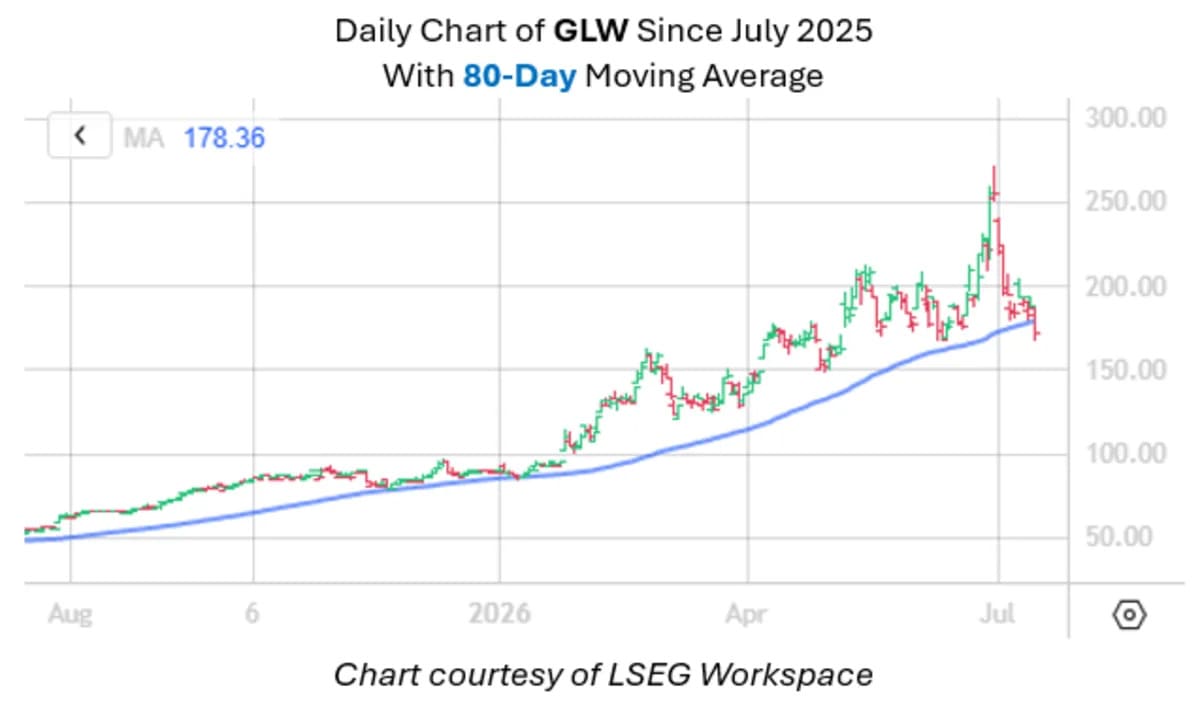
Corning Inc (GLW) shares have dropped 36.4% from their June peak to $172.92. Despite the decline, quantitative analysis indicates a bullish recovery signal based on historical trendline patterns and reduced short interest.
Analysis of Corning Inc (GLW) Market Position and Recovery Potential
Corning Inc (NYSE: GLW) is currently navigating a period of significant price volatility, characterized by a sharp correction following a period of historic growth. After reaching a record peak of $271.38 on June 30, the stock has experienced a substantial drawdown of 36.4%, bringing its current valuation to $172.92. While a drop of this magnitude often signals distress, current quantitative metrics suggest that the stock may be entering a consolidation phase—or a "breather"—that historically precedes a price rebound.
Quantitative Trendline Analysis
The bullish outlook for GLW is primarily driven by a specific technical setup identified by Rocky White, Senior Quantitative Analyst at Schaeffer. The stock is currently trading within 0.75 times the 80-day moving average's 20-day average true range (ATR). This specific metric is critical because it measures the stock's proximity to its long-term trendline relative to its recent volatility. The strength of this signal is further reinforced by the fact that GLW spent at least 80% of the previous two weeks and 80% of the prior 42 trading sessions above this trendline, indicating that the current dip is a deviation from an otherwise established upward trajectory.
Historical Probability and Price Targets
When examining the historical efficacy of this specific technical setup, the data is compelling. Over the last decade, this exact pattern has appeared 19 times for Corning Inc. In 72% of those instances, the stock was trading higher one month after the signal appeared. On average, these recoveries yielded a gain of 4.74%. If the stock follows this historical precedent from its current price of $172.92, it would likely move toward a target price of $181.12, suggesting a moderate but consistent upside potential for investors looking for a recovery entry point.
Short Interest and Market Sentiment
Beyond the technical trendlines, the behavior of short sellers provides additional insight into the stock's stability. Recent reporting indicates that short interest has retreated by 13.7%. Currently, short interest accounts for only 2.6% of the stock's available float. From a market liquidity perspective, this represents less than two days' worth of pent-up buying power. This low level of shorting suggests that there is minimal institutional conviction that the stock will continue to crash, reducing the risk of a prolonged bearish spiral while simultaneously limiting the potential for a violent "short squeeze."
Broader Implications for Tech-Industrial Stocks
Corning's current trajectory reflects the broader volatility seen in the technology and industrial sectors, where record peaks are often followed by sharp corrections as markets recalibrate valuation expectations. The 36.4% decline from the June peak suggests a significant cooling-off period. However, the convergence of a bullish quantitative signal and declining short interest suggests that the market may be finding a structural floor. For GLW, the challenge will be maintaining its position above the 80-day moving average trendline to validate the historical recovery pattern.
Conclusion
In summary, while the recent 7.8% afternoon drop and the overall drawdown from $271.38 appear alarming on the surface, the underlying quantitative data presents a more optimistic narrative. With a 72% historical success rate for this specific setup and a diminishing number of short sellers, Corning Inc appears positioned for a tactical recovery. Investors should monitor whether the stock can maintain its current support levels to reach the projected $181.12 mark.