Lightweight Spring Boot Monitoring Without Prometheus and Grafana
Source Entity
Hacker News
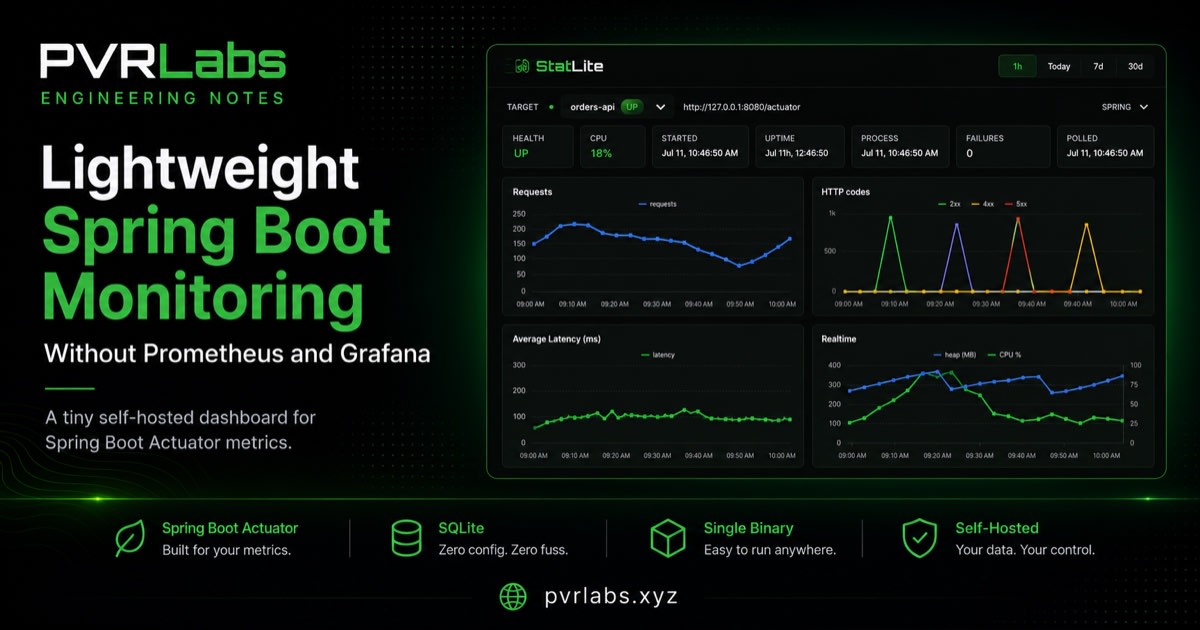
StatLite offers a lightweight alternative to complex monitoring stacks like Prometheus by leveraging Spring Boot Actuator. It provides a simple, Go-based dashboard for tracking essential application health and performance metrics.
Rethinking Lightweight Monitoring for Spring Boot
For developers managing a single Spring Boot application or a small cluster on a Virtual Private Server (VPS), the standard industry-recommended monitoring stacks—typically Prometheus and Grafana—often represent significant overkill. While these tools are industry standards for enterprise-grade observability, their architectural complexity, resource consumption, and maintenance requirements can be burdensome for smaller deployments. The emergence of tools like StatLite addresses this specific gap, providing essential operational visibility without the overhead of heavy infrastructure.
The Role of Spring Boot Actuator
At the core of this lightweight approach is the Spring Boot Actuator, a built-in feature that exposes various operational metrics and health endpoints. Actuator provides deep insights into application state, including health checks, Micrometer metrics, and request processing data. However, Actuator by itself provides raw data in JSON format, which is not human-readable or actionable for developers needing quick status checks. StatLite bridges this divide by acting as a focused dashboard that ingests these endpoints to visualize core performance indicators.
Architectural Efficiency: The Go and SQLite Advantage
StatLite distinguishes itself by being packaged as a single Go binary. This design choice is highly strategic for VPS environments where memory and CPU cycles are at a premium. Unlike Java-based monitoring agents that might compete for resources with the application itself, a Go binary is lightweight and efficient. Furthermore, by utilizing SQLite for history storage, the tool eliminates the need for external database dependencies, making the entire monitoring setup self-contained and exceptionally easy to deploy.
Core Metrics and Operational Visibility
What truly defines the value of a monitoring tool is the specific data it surfaces. StatLite focuses on the metrics that matter most for basic uptime management: application reachability, error rate trends, latency, memory usage, and restart history. By distilling the deluge of information provided by Micrometer into a focused dashboard, it allows developers to maintain situational awareness regarding their application's health without navigating the complex query languages often required by more enterprise-heavy solutions.
Broader Implications for Micro-Deployments
This trend toward 'minimalist observability' signals a shift in how developers approach infrastructure for small-to-medium scale projects. As the ecosystem continues to favor containerization and distributed services, there is a growing demand for tools that prioritize simplicity over feature depth. For developers who do not require long-term retention or complex alerting rules, tools like StatLite demonstrate that visibility does not have to be synonymous with complexity.
Future Trends in Application Monitoring
Looking ahead, we can expect a continued bifurcation in the monitoring market. While large enterprises will continue to rely on full-stack observability platforms, the rise of specialized, lightweight tools will likely increase. As more developers seek to reduce their 'dependency footprint,' we anticipate further growth in tools that leverage existing framework endpoints (like Actuator) to provide immediate, context-aware insights, effectively democratizing operational health monitoring for solo developers and small teams.