Central Pollution Body Explains Data Gaps On Diwali Night
Source Entity
NDTV News Search Records Found 1000
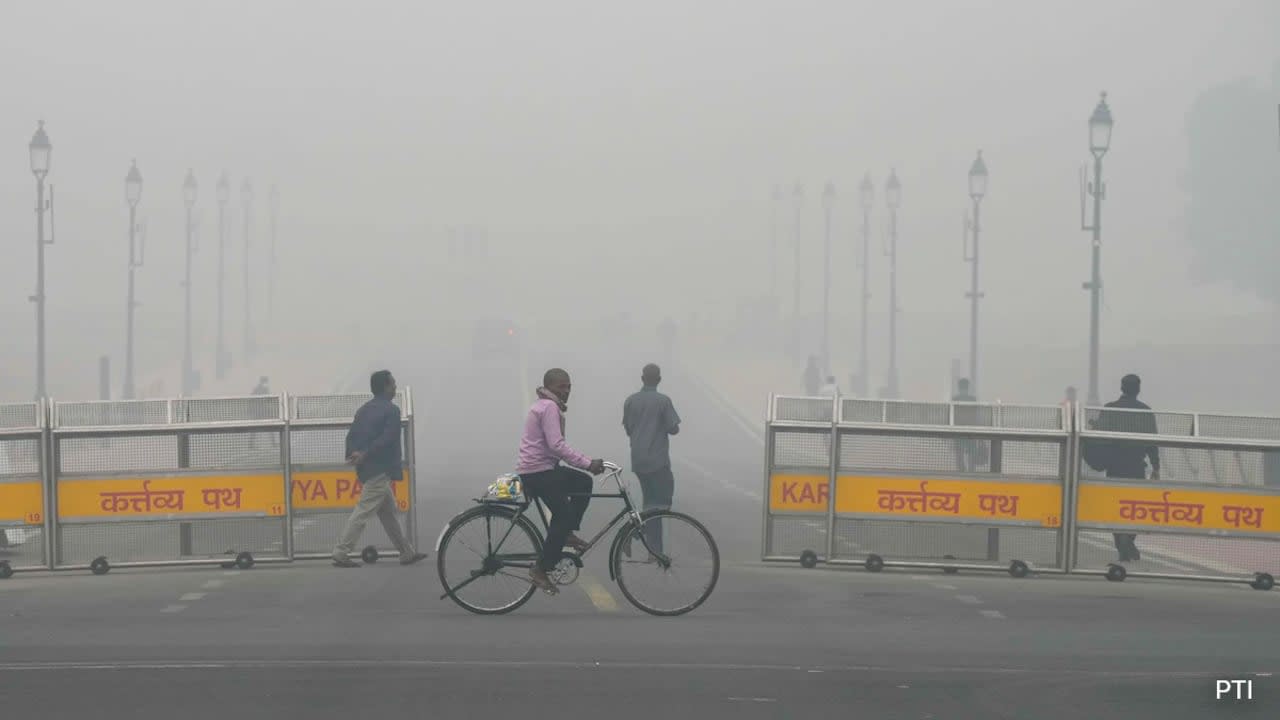
Inland Maharashtra cities reported significantly poorer air quality than Mumbai following Diwali, with Pimpri Chinchwad exceeding an AQI of 300. Concurrently, the CPCB has capped PM2.5 monitoring readings at 1,000 μg/m³, sparking debate over reporting accuracy.
The Post-Diwali Air Quality Crisis in Maharashtra
Recent post-Diwali air quality data has unveiled a stark contrast between coastal and inland Maharashtra. While Mumbai’s air quality fluctuations—rising from 131 to 278 on the Air Quality Index (AQI)—have captured significant public attention, data from the Central Pollution Control Board (CPCB) indicates that inland cities faced a far more severe environmental burden. On November 9, 13 cities across the state recorded AQI levels categorized as ‘poor’ or ‘very poor,’ with Pimpri Chinchwad emerging as the most affected, hitting a staggering 301.
The Shift in Pollution Trends
Comparative analysis shows a concerning upward trend in regional pollution. Of the ten worst-hit cities this year, only Nanded fell into the ‘poor’ category during the same period last year. This year, the entire list of the ten most polluted cities in the state reached the ‘poor’ threshold, signaling a broader degradation of air quality that extends well beyond traditional urban hotspots. Pune, in particular, saw its pollution levels surge to 2.5 times the figures recorded in the previous year.
Meteorological Factors in Mumbai
Despite the regional spike, Mumbai managed to maintain a ‘moderate’ status with an AQI of 172. Professor Gufran Baig of the National Institute of Advanced Studies (NIAS) attributes this relatively better performance to meteorological interventions. Increased wind speeds from the sea and a favorable shift in wind direction over a 48-hour period served as a natural ventilation mechanism, effectively dispersing pollutants that might have otherwise stagnated due to firecracker emissions.
CPCB Methodology and Data Transparency
Controversy has emerged regarding how the CPCB processes environmental data. The board recently announced a cap on ambient air quality monitoring readings at 1,000 micrograms per cubic meter (μg/m³), stating that values exceeding this threshold will not be factored into the National Air Quality Index (NAQI). The CPCB justifies this by arguing that the index is designed to measure “prolonged exposure” rather than “momentary readings,” though this policy is currently under review alongside evolving international monitoring practices.
Monitoring Infrastructure Challenges
Concerns regarding data integrity are further complicated by systemic infrastructure issues. Reports indicate that over two-thirds of the capital's 59 air-quality monitoring stations were offline during the peak hours of Diwali—between 10 pm and 6 am. This lack of continuous data during the highest period of firecracker usage raises significant questions about the accuracy of public health reporting and the ability of authorities to assess the true impact of seasonal pollution spikes.
Future Implications for Urban Health
Looking ahead, the disparity between inland and coastal air quality necessitates a localized approach to environmental policy. As inland cities in Maharashtra continue to see worsening trends, the reliance on natural dispersion—which saved Mumbai this year—is clearly insufficient. Future trends suggest that without stricter regional regulations and more robust, uninterrupted monitoring infrastructure, the ‘poor’ air quality label may become a permanent fixture for many of these growing urban centers.
Multiple Citing Sources
Verification Required?