How Do I Profile eBPF Code?
Source Entity
Hacker News
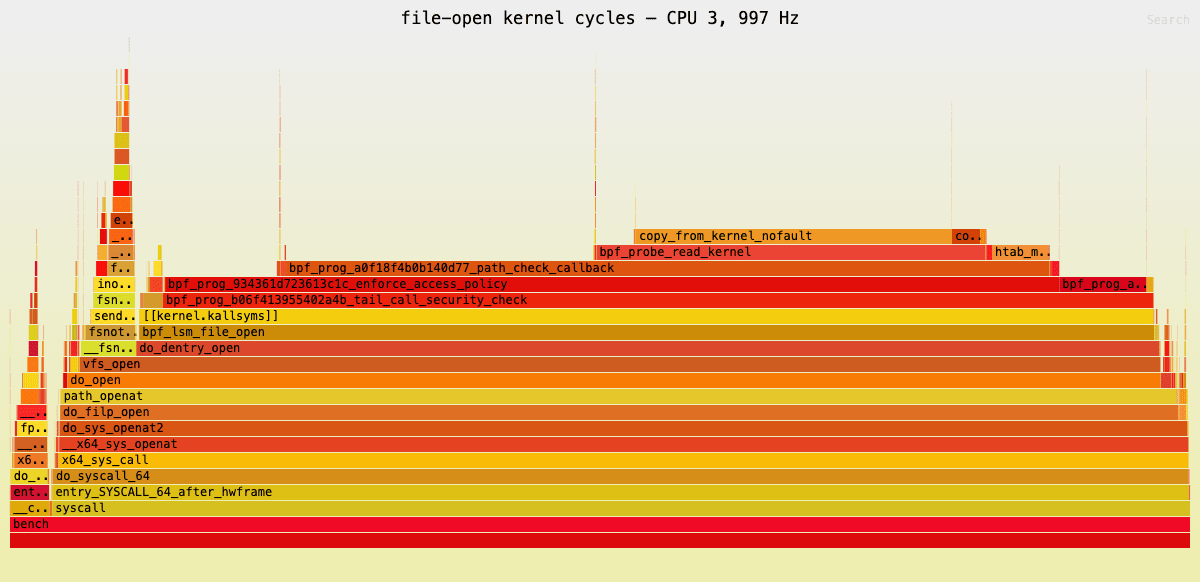
This technical guide explores methods for profiling eBPF code performance, specifically targeting file open operations. It provides a foundational C-based test harness to measure the overhead introduced by eBPF hooks in kernel-level programming.
Understanding eBPF Performance Profiling
Extended Berkeley Packet Filter (eBPF) has revolutionized how developers interact with the Linux kernel, allowing for high-performance monitoring, networking, and security observability without modifying kernel source code. However, as these programs become more complex, the ability to measure their performance impact is critical. When deploying eBPF hooks—particularly those intercepting high-frequency system calls—developers must ensure that the observability tool does not become a bottleneck itself.
The Criticality of System Call Monitoring
The focus on 'file open' operations is highly strategic. File system access is one of the most fundamental interactions between user-space applications and the operating system kernel. By hooking into these operations, developers can gain deep insights into application behavior, security anomalies, or resource utilization. Because these calls are so frequent, even a marginal increase in latency caused by an eBPF program can have a compounding effect on overall system performance.
Designing the Test Harness
To accurately measure the overhead, the approach involves creating a lightweight C test harness. By minimizing external dependencies, the developer ensures that the measurements are not skewed by library bloat or complex runtime environments. The provided code snippet, which includes headers such as fcntl.h and time.h, demonstrates the necessity of high-precision timing mechanisms, such as now_ns, to capture the nanosecond-scale performance deltas introduced by kernel hooks.
Analyzing Overhead and Bottlenecks
Profiling eBPF code requires a rigorous methodology. The goal is to isolate the execution time of the hook itself versus the native cost of the open system call. By establishing a baseline without the hook and then comparing it to the instrumented version, developers can pinpoint where the eBPF program is consuming CPU cycles. This process is essential for maintaining the 'zero-cost' or 'low-cost' promise that makes eBPF an attractive alternative to traditional kernel modules.
Future Trends in Kernel Observability
As Linux kernel development continues to prioritize eBPF for observability, the tooling ecosystem is shifting toward more automated profiling. While manual C test harnesses remain the gold standard for precision, we expect to see more integrated profiling frameworks that automate these benchmarks. Understanding the underlying mechanics of how eBPF hooks interact with the kernel’s scheduler and memory management remains a vital skill for systems engineers.
Conclusion
Profiling eBPF code is not merely a technical exercise but a necessity for robust system performance. By utilizing precise, low-dependency test harnesses to monitor critical paths like file open operations, engineers can ensure that their observability tools remain efficient. This foundational approach to performance measurement is the key to scaling eBPF deployments in production environments.